
Overview
The microscopic examination of tissue morphology using Hematoxylin and Eosin (H&E) is the standard practice in histopathology for visual analysis of tissue specimens. One of the most common features for which pathologists evaluate H&E images is overall percent tumor area. This is important not only to the ultimate diagnosis of cancer, but also to prognostic outcomes, and to demarcating what image regions of interest should be considered for future analysis of other biologically relevant markers such as angiogenesis, immune cell infiltration, or over expression of cancer-specific proteins like HER2 or BRCA1/2 in the case of breast cancer.
Data
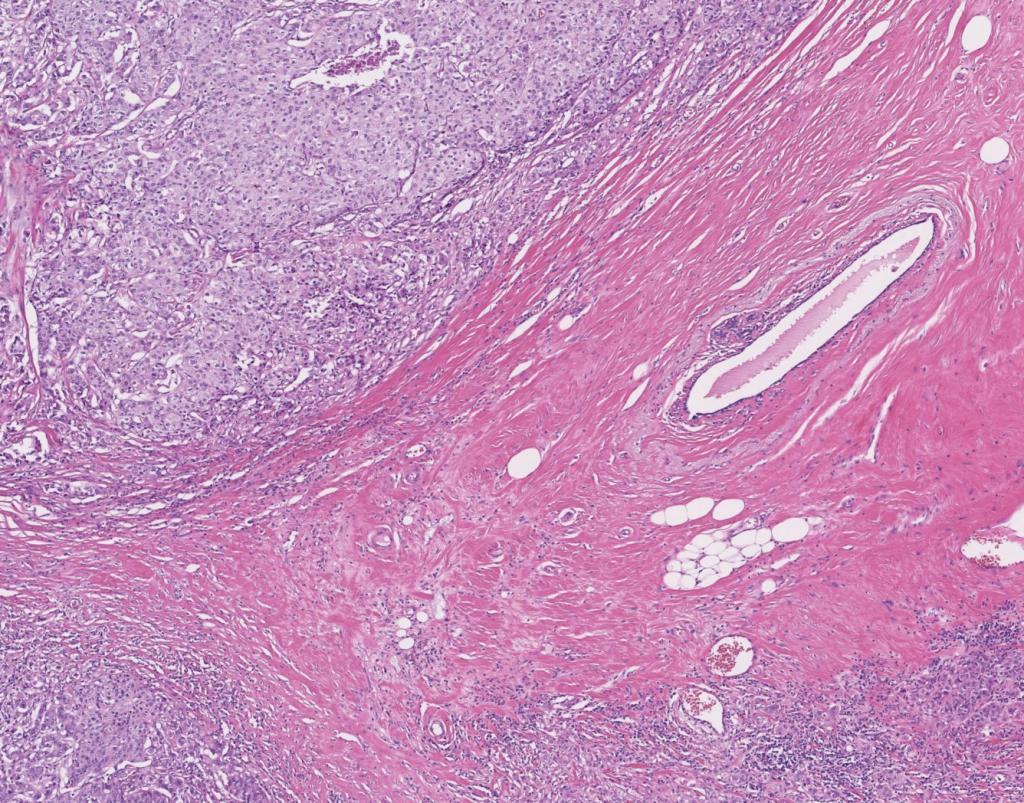
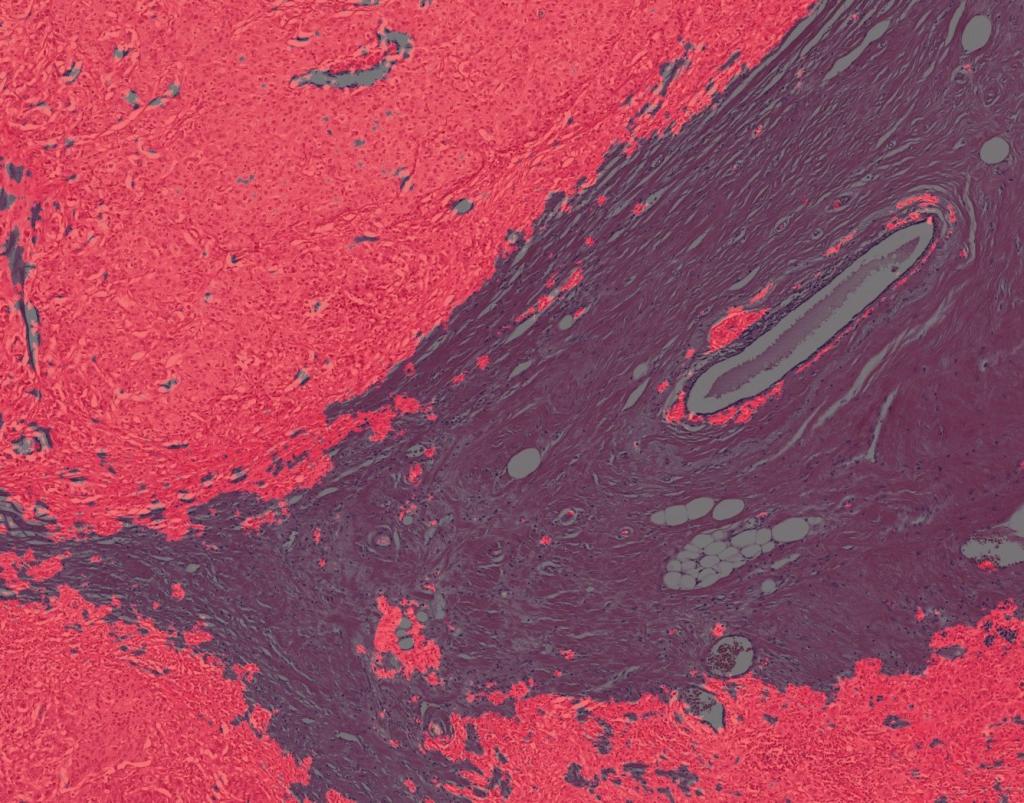
Figure 1. Example of tumor area fraction in breast cancer lumpectomy tissue biopsy H&E image, determined using a machine learning approach. The outlined tumor area is highlighted in red superimposed on the original image. Drag the slider to switch between images before and after segmentation.
Protocol
| Instrument | Aperio XT2 Slide Scanner |
| Analysis Method | Brightfield Imaging |
| Markers | Hematoxylin and Eosin (H&E) |
| Sample Submission | Whole Tissue fixed and stored in PBS with 0.05% azide Formalin Fixed Paraffin Embedded (FFPE) tissue blocks Tissues embedded in OCT Pre-stained and mounted slides Digitized slide images |
| Imaging Parameters | 20X, 40X magnification |
| Image Analysis | Cell counting Tumor area quantification Analysis of Nuclear Morphology |
| Data Delivery | Whole Slide Images in RGB format, ROI masks (e.g. tumor vs. non-tumor regions), data tables containing cell counts |
General Procedure
- Tissue sample is transferred to Visikol in PBS w/ 0.05% azide or in a form most appropriate for the customer (e.g. FFPE, OCT compound).
- Alternatively, mounted and stained slides or digitized images of H&E slides can be sent for analysis.
- The sample is processed, sectioned, and stained with Hematoxylin and Eosin.
- The sample slides are imaged with high-throughput slide scanner at desired magnification.
- The images are then processed and analyzed according to customer specifications.
- Images and quantification report are then transferred to the customer.
References:
- Feldman, A.T., Wolfe, D. (June 2014). “Tissue Processing and Hematoxylin and Eosin Staining”. Histopathology. pp. 31-43.