
Background
- Assessing the distribution of biologicals for drug development is a costly and time consuming process typically requiring the use of animal studies. Heterogeneous distribution of biologicals (especially antibody drugs) in tumor tissue has been recognized as a major issue for immunotherapy since before 2000 [1].
- Transport of biologicals (e.g. antibody therapeutics) into tissues is a complex process involving a combination of factors. The main mechanism by which biologicals distribute throughout tissue is convective transport. In healthy tissues, extracellular fluid flows steadily from the capillaries to the lymphatic vessels, driving transport of macromolecules throughout the tissue. However, in solid tumors, functional lymphatic vessels are rare, leading to an increase in hydrostatic pressure, reducing the propensity of the convection gradient to drive macromolecules into the tumor [1, 2]. After permeation into the tissue compartments, distribution relies on a balance of diffusion, convection and affinity to target antigens within the interstices and cell surfaces.
- With growing interest in biologicals and their derivatives, antibody drug conjugates, antibody fragments (e.g. Fab), alternate domain antibodies (e.g. camelids), affibodies and nanobodies, a method for screening the relative differences in distribution of these molecules would be of great value.
- Utilizing tumor spheroid models, the distribution of biologicals, antibody therapeutics, antibody drug conjugates, etc. into solid tumor models can be measured in vitro.
Protocol
| Instrument | Molecular Devices ImageExpress Micro Confocal |
| Analysis Method | High content screening |
| Markers | DAPI |
| Cell Model Type | Tumor spheroids Tissue biopsy/necropsy |
| Cell Types Available | ATCC cancer cell lines (e.g. A549, BT549, MCF-7) Primary cancer cells Client provided cells or tissue biopsies/necropsies Custom models available on request |
| Test Article Concentration | 8 point assay (20 ug/mL, 10 ug/mL, 2 ug/mL, 1 ug/mL, 400 ng/mL, 200 ng/mL, 100 ng/mL, 20 ng/mL) (custom concentrations available) Single point assay |
| Time points | 0.5 hr, 1 hr, 2 hr, 4 hr, 8 hr, 24 hr, 48 hr (Custom time points available) |
| Number of Replicates | 3 replicates per concentration |
| Quality Controls | 0.5% DMSO (vehicle control) anti-β-integrin (positive control) |
| Test Article Requirements | 200 uL of 200 ug/mL solution of biological |
| Data Delivery | Distribution curves, velocity curves, TD50 (time to distribute to 50% of total) values, concentration-time curves (measured as AUC) |
General Procedure
- Generation of free-floating tumor spheroids, grown to approximately 200 μm in diameter
- Treatment of viable tumor spheroids with antibody therapeutic at various concentrations
- Fixation of tumor spheroids at specified time points
- Labeling of antibody with fluorescent secondary to label therapeutic antibody; nuclei labeled with DAPI
- Application of tissue clearing to render tumor spheroids transparent
- High content confocal imaging
- Analysis of resultant images to assess distance and quantity of Ab penetration into tumor spheroid
Representative Data
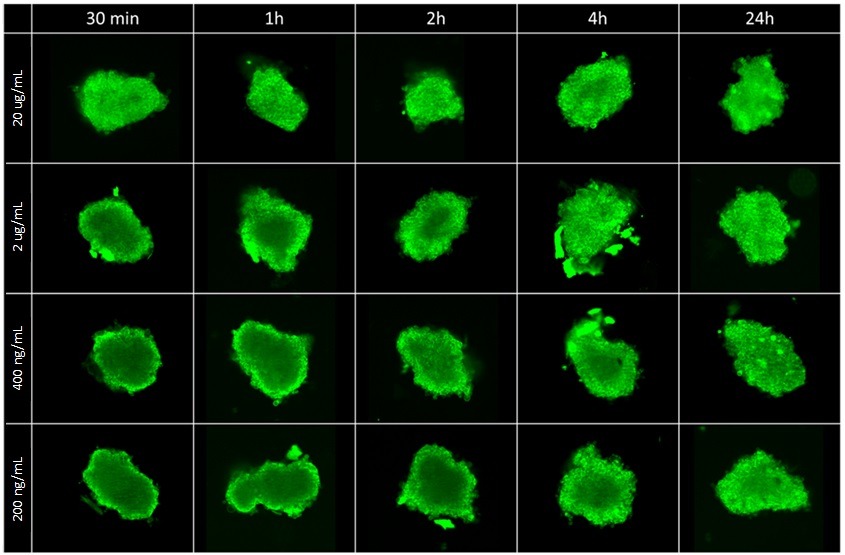
Figure 1. Confocal sections from center of HepG2 tumor spheroids depicting relative distribution of anti-β-integrin antibody at various concentrations and times.
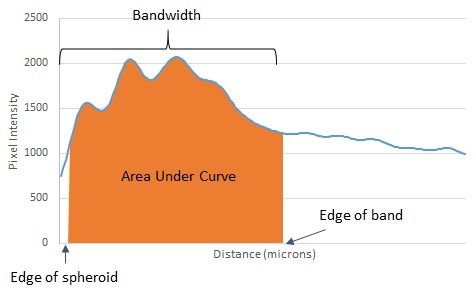
Figure 2. Representative curve depicting parameters used for quantitation of antibody distribution into tumor spheroids.

Figure 3. Antibody concentration is measured as a mean of pixel intensity in concentric bands of decreasing radius from the edge of the tumor spheroid into the center.

Figure 4. Quantitative measurements of extent of distribution of antibody into tumor spheroids. Left: Quantitation of bandwidth (width of band of antibody detected in spheroid) at varying doses and timepoints; Right: Semiquantitative measurement of concentration (measured as area under pixel intensity curve, shown in Fig. 2) at varying doses and timepoints.
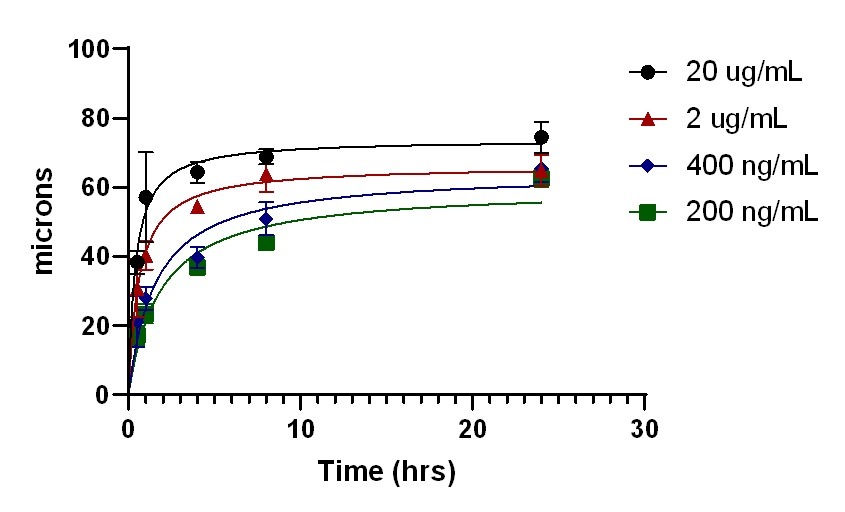
Figure 5. Antibody distribution curve depicting penetration of antibody into tumor spheroid at varying doses over time.
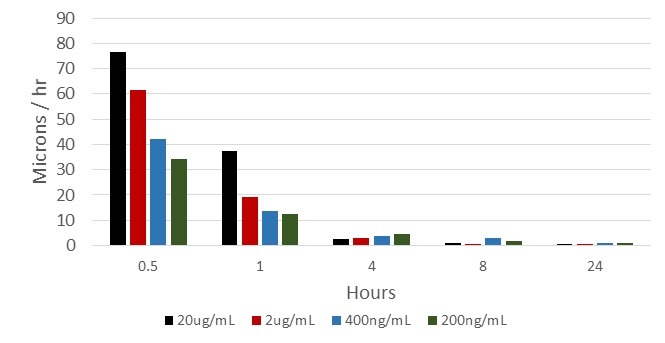
Figure 6. Dose and time dependence of velocity of antibody distribution.
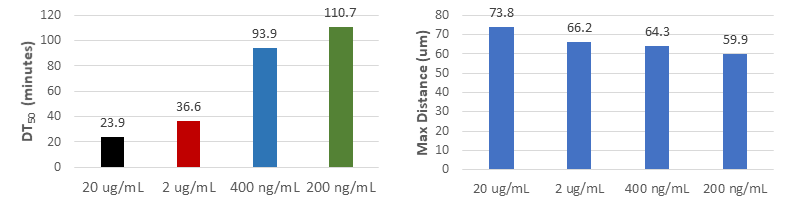
Figure 6. Time to distribute to 50% of spheroid radius (DT50) and maximum distance of penetration
References
- Thurber, G. M., Schmidt, M. M., & Wittrup, K. D. (2008). Antibody tumor penetration: transport opposed by systemic and antigen-mediated clearance. Advanced drug delivery reviews, 60(12), 1421-1434.
- Ryman, J. T., & Meibohm, B. (2017). Pharmacokinetics of monoclonal antibodies. CPT: pharmacometrics & systems pharmacology, 6(9), 576-588.

