Our tissue imaging services have been engaged by a wide variety of clients in pharma and academia. While we specialize in 3D imaging for thick tissue specimens and whole mount preparations, we also offer labeling and imaging services on tissue sections, flat mounts, and thin tissue specimens. Described below are some representative applications of the types of projects we have been contracted to conduct on behalf of our clients.
Quantification of Activation of Astrocytes and Microglia in Brain Tissue
Brain tissue is complex, possessing many unique regions that respond and behave differently to stimulus and treatments. Astrocytes and microglia serve important roles in the regulation of inflammation in brain tissue, especially in response to traumatic brain injury. In response to injury, astrocytes and microglia become activated. Due to the relevance of astrocytes and microglial cells in regulating inflammatory response during disease and injury, there is distinct interest in their microscopic examination.
In an experimental examination of the response of astrocytes and microglia in rat brain tissue to traumatic insult, 1 mm sagittal sections of rat brain tissue were labeled for GFAP (glial fibrillary acidic protein, expression increased in reactive astrocytes) and Iba1 (microglia). Astrocytes were identified as activated if they showed a significant increase in GFAP labeling compared to control tissues, microglia were considered activated if they showed a significant increase in Iba1 labeling, and changes in morphology associated with microglia activation (e.g. bushy or ameboid morphology).

Figure 1. Representative images of rat brain immunolabeled with GFAP (green); Left: Control brain tissue; Right: Rat brain 3 days after mechanically induced traumatic brain injury
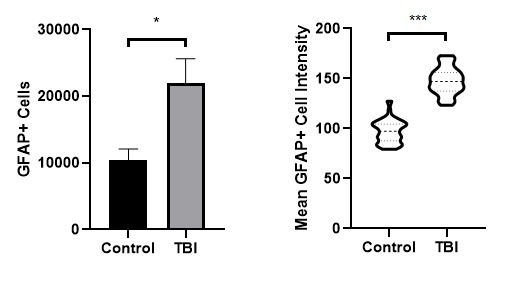
Figure 2. Measured number of GFAP+ cells (left) and distribution of GFAP labeling intensity (right). * indicates statistical significance

Figure 3. Representative images of rat brain immunolabeled with Iba1 (green); Left: Control brain tissue; Right: Rat brain 3 days after mechanically induced traumatic brain injury
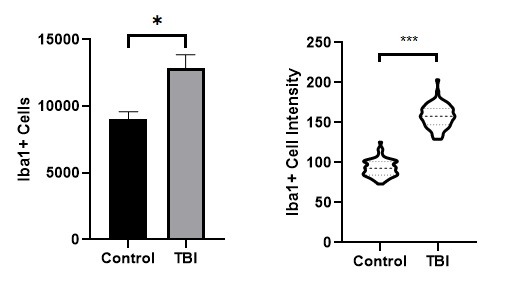
Figure 4. Measured number of Iba1+ cells (left) and distribution of Iba1 labeling intensity (right). * indicates statistical significance
Investigation of the Spread of Zika Virus in Mouse Mammary Tissue
During the 2015-2016 Zika virus outbreak, there was an explosion of research to characterize the pathogenesis and transmission of the Zika virus. Due to the devastating effects of this virus on newborns, causing the induction of microcephaly, there is widespread public concern about Zika virus infection. This prompted widespread research efforts to better understand the disease.
Researchers at the Division of Inflammation Biology at La Jolla Institute for Allergy & Immunology collaborated with Visikol to publish a study examining mammary tissue and breast milk of Zika-infected mice for the presence of Zika virus. Utilizing tissue clearing and 3D confocal imaging, presence of the Zika virus was detected in intact mammary tissue. This work was recently published in PLOS Neglected Tropical Diseases.

Figure 5. Representative confocal images depicting immunolabeling for Zika virus infection in mouse mammary tissue
Analysis of Blood Vessel Networks in Alzheimer’s Disease Model Mice
With two recent high-profile failures of promising treatments to Alzheimer’s Disease (AD) in Phase III clinical trials (Bapineuzumab, Solanezumab) which targeted amyloid β plaques occurring in AD, there has been a revival of basic research toward new targets and pathologies relevant to the disease. Toward these efforts, there has been much interest in examining the roles of inflammation and the roles of blood vessel networks in contributing to AD. It is believed that changes in and damage to blood vessel networks in the brains of AD patients contribute to AD-related dementia.
Quantification of changes in the tortuosity of blood vessel networks in AD mouse models was conducted utilizing immunolabeling and 3D imaging of 1 mm mouse brain sections. Reconstruction of the blood vessel network in 3D allowed for analysis of branching patterns and branch length, which provided quantitative measures of alterations in the blood vessel networks in the triple transgene 3xTg AD mouse models compared to BALB/cJ mouse brains.
Tortuosity is a measure of how curved a blood vessel is, calculated for this work as the ratio of the branch length to the distance between the branch’s endpoints. Increasing tortuosity results in less efficient blood flow through the vessels, since more linear distance must be traveled to reach the endpoint of a vessel. The average blood vessel tortuosity in the brain of mice is approximately 1.2, meaning that the ratio of the branch length to the distance between the ends of the branches is approximately 5 to 4. Significant differences in the blood vessel network were detected between BALB/cJ and 3xTg mouse models.
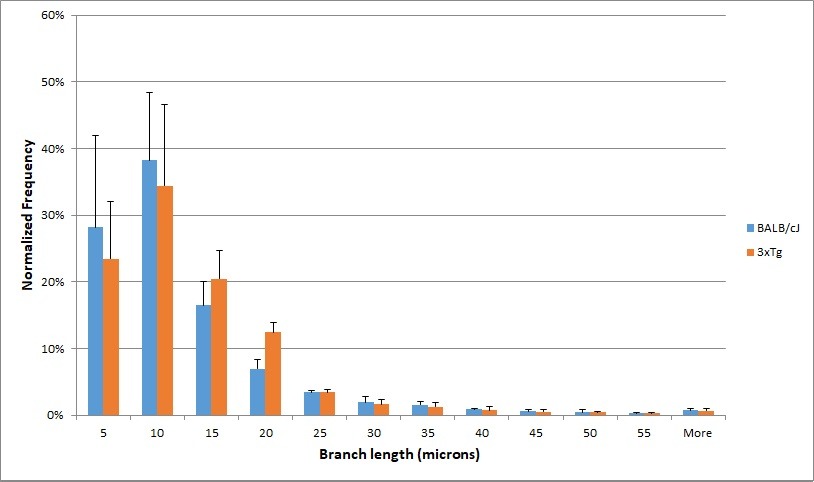
Figure 6. Histogram depicting distribution of branch length of blood vessels in mouse model brains
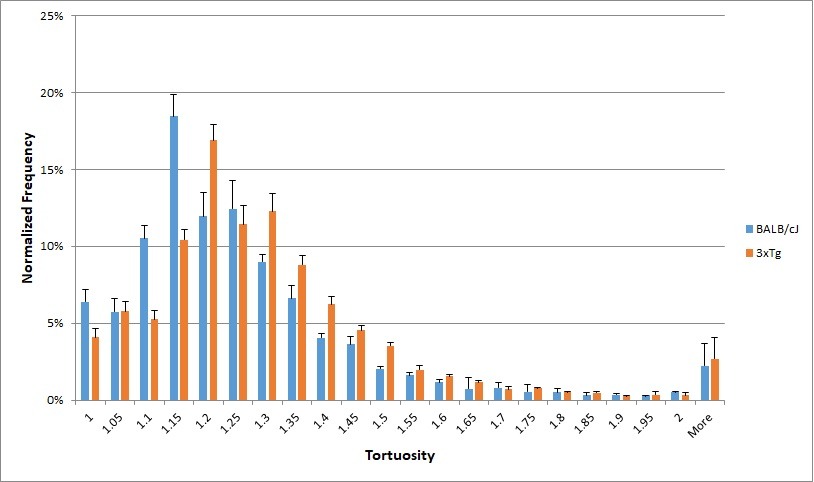
Figure 7. Histogram depicting distribution of tortuosity, defined as the ratio of branch length to distance between the endpoints, of blood vessels in mouse model brains
A similar approach has been applied in the investigation of villous blood vessel networks in human placenta. It is thought that changes in the blood vessel network of placentae can contribute to complications during pregnancy such as pre-eclampsia and eclampsia, and utilizing immunolabeling and tissue clearing, quantitative analysis of blood vessel networks in portions of human placenta tissue were examined. This work has been published in JoVE (https://www.jove.com/video/57099/three-dimensional-rendering-analysis-immunolabeled-clarified-human).

