
Overview
In the past decade, there have been considerable advances in the state of the art of immuno-oncology. With the regulatory approval of the T cell checkpoint inhibitory antibody ipilimumab (Yervoy, Bristol-Meyers Squibb), research into novel approaches to modulate the immune response to cancer for therapy has been ushered into a new era. The goal of immuno-oncology is to understand how the components of the immune system interact with the tumor microenvironment, to understand how these interactions contribute to the outcome of the patient, and to modulate the immune response in a way that reduces tumor growth, ideally toward the elimination of tumor cells.
For decades, it has been known that the presence of tumor-infiltrating immune cells is associated with better prognosis of cancer patients. It has been recognized that there are at least three different but related outcomes: elimination, equilibrium, and escape [1]. A highly immunogenic tumor in a healthy, immunocompetent individual will stimulate the innate immune response resulting in acute inflammation, activation of T and B cells, and elimination of the newly arisen tumor. For an individual with a less surveillant immune system, or a less immunogenic tumor, a state of equilibrium may be reached—the immune system would eliminate some but not all tumor cells, leading to reactivation of the immune system, incomplete elimination, and repeated cycling of partial elimination. This equilibrium can be life-long or may be disturbed by changes in the tumor which allow it to avoid immunosurveillance. Tumors which avoid detection by the immune system enter the “escape” phase, in which most cancers are currently diagnosed. Escape from immunosurveillance is due to myriad factors, ranging from downregulation of tumor antigens, loss of human leukocyte antigen molecules, loss of sensitivity to T cell or NK cell lysis, or prevention of the expansion of tumor-antigen specific helper and cytotoxic T cells, leading to an accumulation in suppressive cell populations, inhibiting immunity [2]. The aim of immuno-oncological therapy is to modulate tumor immunity to promote tumor-rejection.
Evaluation of tissue sections to interrogate the immune cell populations within tumor tissue is a critical endpoint to assess the efficacy of immunomodulating cancer therapies. Due to the wide variety of immune cell types and sub-types, multiplex immunofluorescence, which allows for the simultaneous interrogation of multiple cell populations, is required. We employ a series of sophisticated automated image processing algorithms to assess the variety and distribution of immune cells within and around tumor tissue.
Protocol
| Analysis Method | Fluorescent Imaging |
| Markers | Immunohistochemistry (fluorescence) |
| Sample Submission | Whole Tissue fixed and stored in PBS with 0.05% azide Formalin Fixed Paraffin Embedded (FFPE) tissue blocks Tissues embedded in OCT Pre-stained and mounted slides Digitized slide images |
| Imaging Parameters | 20X, 40X magnification |
| Image Analysis | Cell counting Biomarker colocalization analysis Nearest neighbor analysis Infiltration distance assessment |
| Data Delivery | Whole Slide Images in RGB format, ROI masks (e.g. CD3+ cells), Data tables containing cell counts or area for biomarkers Histograms of spatial distribution for nearest neighbor analysis Statistical analysis Other quantification strategies available on request |
General Procedure
- Tissue sample is transferred to Visikol in PBS w/ 0.05% azide or in a form most appropriate for the customer (e.g. FFPE, OCT compound).
- Alternatively, mounted and stained slides or digitized images of IHC sections can be sent for analysis.
- The sample is processed, sectioned, and stained using immunohistochemistry techniques.
- The sample slides are imaged with high-throughput slide scanner at desired magnification.
- The images are then processed and analyzed according to customer specifications.
- Images and quantification report are then transferred to the customer.
Representative Data
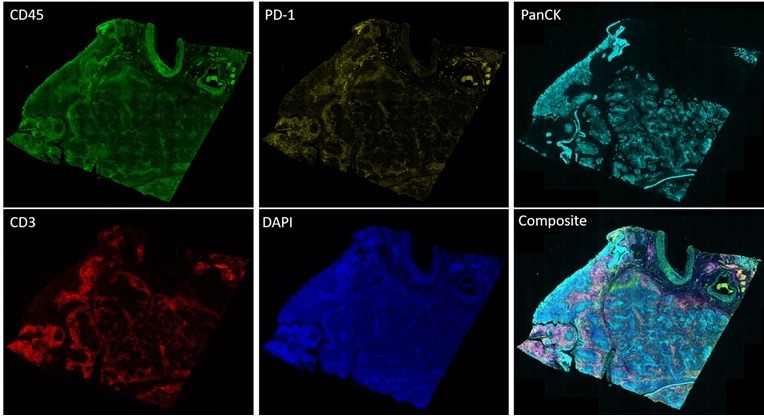
Figure 1. Whole slide image of lung cancer section immunolabeled for CD3, CD45, PD-1 and PanCK.

Figure 2. Whole slide image of lung cancer section labeled with DAPI (nuclei), CD3 (green), CD45 (red), and PD-1 (yellow). The zoomed-in image on the right depicts the identified tumor region outlined in white.


Figure 3. Heatmap of lung cancer tissue section depicting number of CD3+ cells as a function of distance into the tumor.

Figure 4. Quantitation of immune cells by type in tumor and stroma of lung cancer tissue section

Figure 5. Distribution of immune cells within lung cancer tumor region.

Figure 6. Analysis and quantification of immune cell infiltration distance into solid lung tumor.

Figure 7. Distribution of infiltration distance of immune cells in lung tumor section
Table 1. Comparison of relative infiltration distance by immune cell type (ANOVA with Tukey’s multiple comparisons test)
| Marker | Mean Difference (microns) | P Value |
|---|---|---|
| CD3 vs. CD45 | 4.195 | <0.0001 |
| CD3 vs. PD-1 | 5.659 | <0.0001 |
| CD3 vs. CD45/PD-1 | 6.436 | <0.0001 |
| CD3/CD45 vs. CD45 | 4.986 | <0.0001 |
| CD3/CD45 vs. PD-1 | 6.450 | <0.0001 |
| CD3/CD45 vs. CD45/PD-1 | 7.227 | <0.0001 |
| CD3/PD-1 vs. PD-1 | 4.549 | 0.0009 |
| CD3/PD-1 vs. CD45/PD-1 | 5.326 | 0.001 |
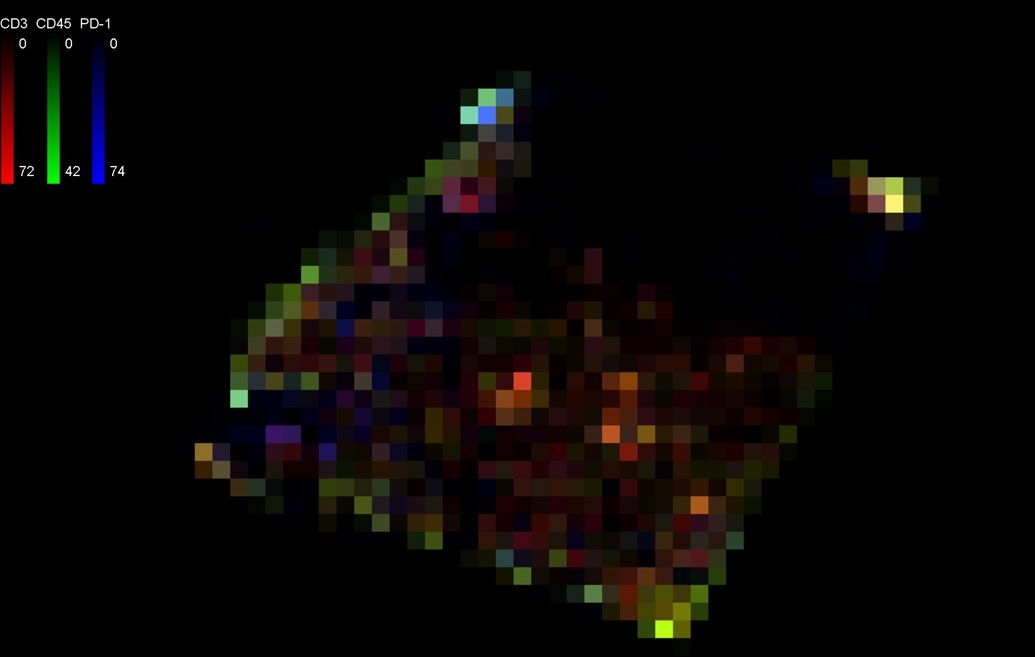
Figure 9. Isodensity plot illustrating distribution of CD3, CD45 and PD-1 labeled immune cells within tissue specimen within 150 micron-width grid
References:
- Schreiber, R. D., Old, L. J., & Smyth, M. J. (2011). Cancer immunoediting: integrating immunity’s roles in cancer suppression and promotion. Science, 331(6024), 1565-1570.
- O. J. Finn, Immuno-oncology: understanding the function and dysfunction of the immune system in cancer, Annals of Oncology, Volume 23, Issue suppl_8, September 2012, Pages viii6–viii9