
Overview
Immunohistochemistry (IHC), immunofluorescence (IF), and histological stains provide valuable insights into the distribution of relevant biomarkers and structural changes in tissue samples. At Visikol, we understand the importance of accurate and efficient analysis in evaluating biomarkers for disease pathology. That’s why we offer a comprehensive suite of services for the quantification and analysis of IHC sections.
Traditionally, the analysis of IHC slides involved subjective interpretation by a pathologist, often relying on scoring systems to assess the presence or absence of specific markers. However, with the advancement of computational techniques and image processing, we can now achieve quantitative analysis on a large scale and in a fraction of the time.
Our Biomarker Area Quantification service utilizes cutting-edge technology to provide robust and reliable quantification of biomarkers in tissue sections. We employ a sophisticated thresholding approach to segment the biomarkers of interest, followed by accurate measurement of their respective areas. This enables us to precisely quantify the extent and distribution of specific biomarkers within the tissue samples.
Moreover, we understand that the interaction between multiple biomarkers can be crucial in understanding disease mechanisms. Our service also includes the evaluation of biomarker colocalization, allowing us to assess the degree of coincidence between different markers. This analysis provides valuable insights into the examination of changes in biomarker expression within tissues.
By leveraging our state-of-the-art image analysis software and expertise in bio-image analysis, we ensure the highest level of accuracy and reproducibility in our quantification services. Our team of experienced scientists is dedicated to delivering precise results and helping you gain deeper insights into your research.
Key Features of our Biomarker Area Quantification Service:
- Quantitative Analysis: We provide objective and quantitative assessment of biomarker areas within tissue samples, reducing subjective interpretation and improving the reliability of your results.
- Biomarker Colocalization: Our services enable the evaluation of colocalization between multiple biomarkers, allowing for a comprehensive understanding of their spatial relationships and functional implications.
- Efficient and Fast: With advanced computational techniques, we offer rapid analysis of large numbers of tissue sections, saving you time and resources.
- Expert Analysis: Our team of skilled scientists possesses extensive expertise in bio-image analysis, ensuring accurate and reliable results for your research.
General Procedure
- Images are checked to make sure the quality of the images is good for analysis.
- Biomarkers are thresholded and the entire tissue area is obtained.
- Area measurements are extracted for individual biomarkers and biomarker combinations.
- The organized data and report are then delivered to the client.
Protocol
| File Formats | TIFF, PNG, JPEG, CZI, MCD, SCN |
| Image Submission | Hard Drive Visikol Cloud Sharing Client selected file sharing service |
| Data Delivery | Report |
Representative Data
Evaluation of Hormone Receptors in Clinical Breast Cancer Biopsy Sections
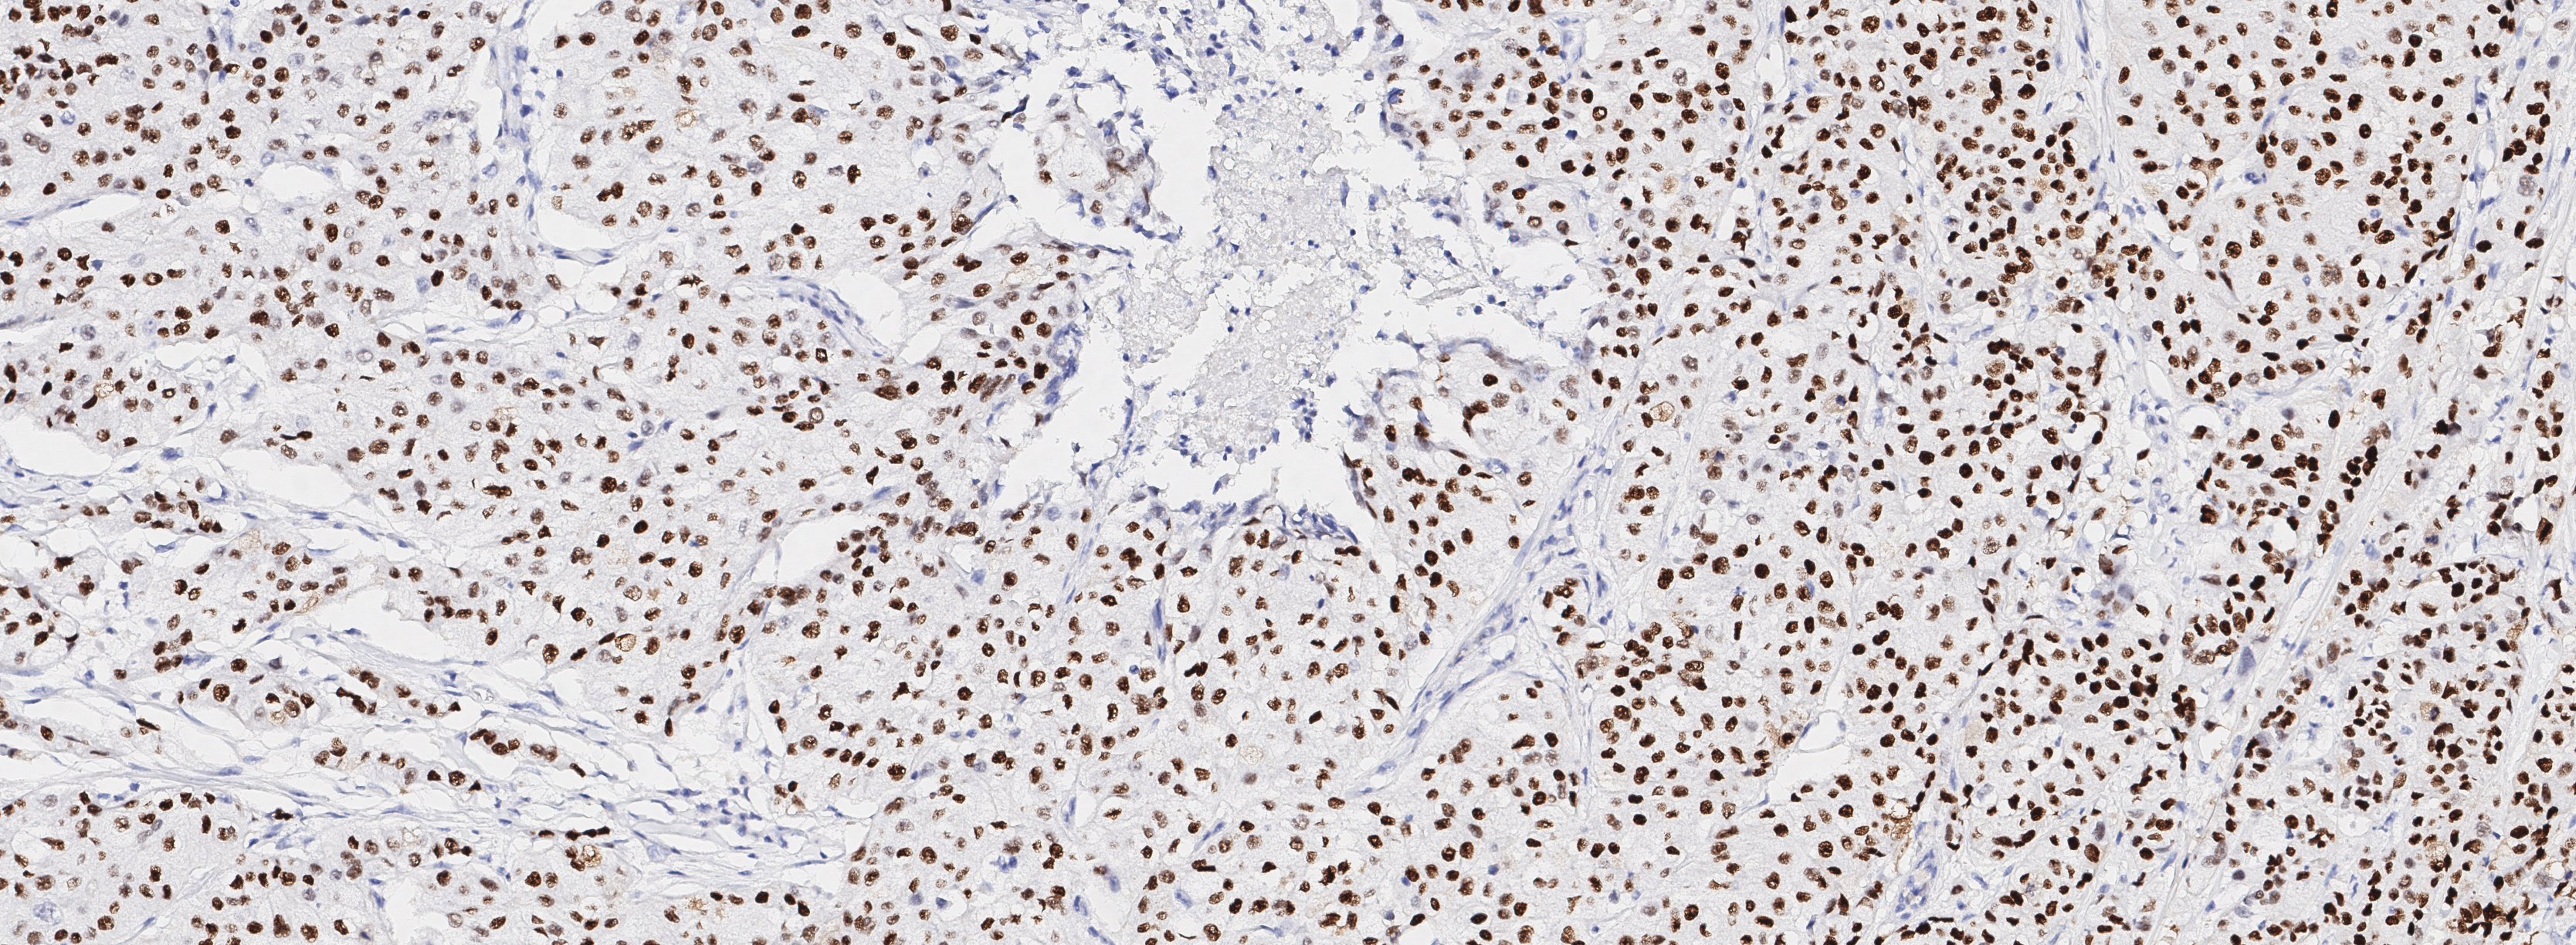
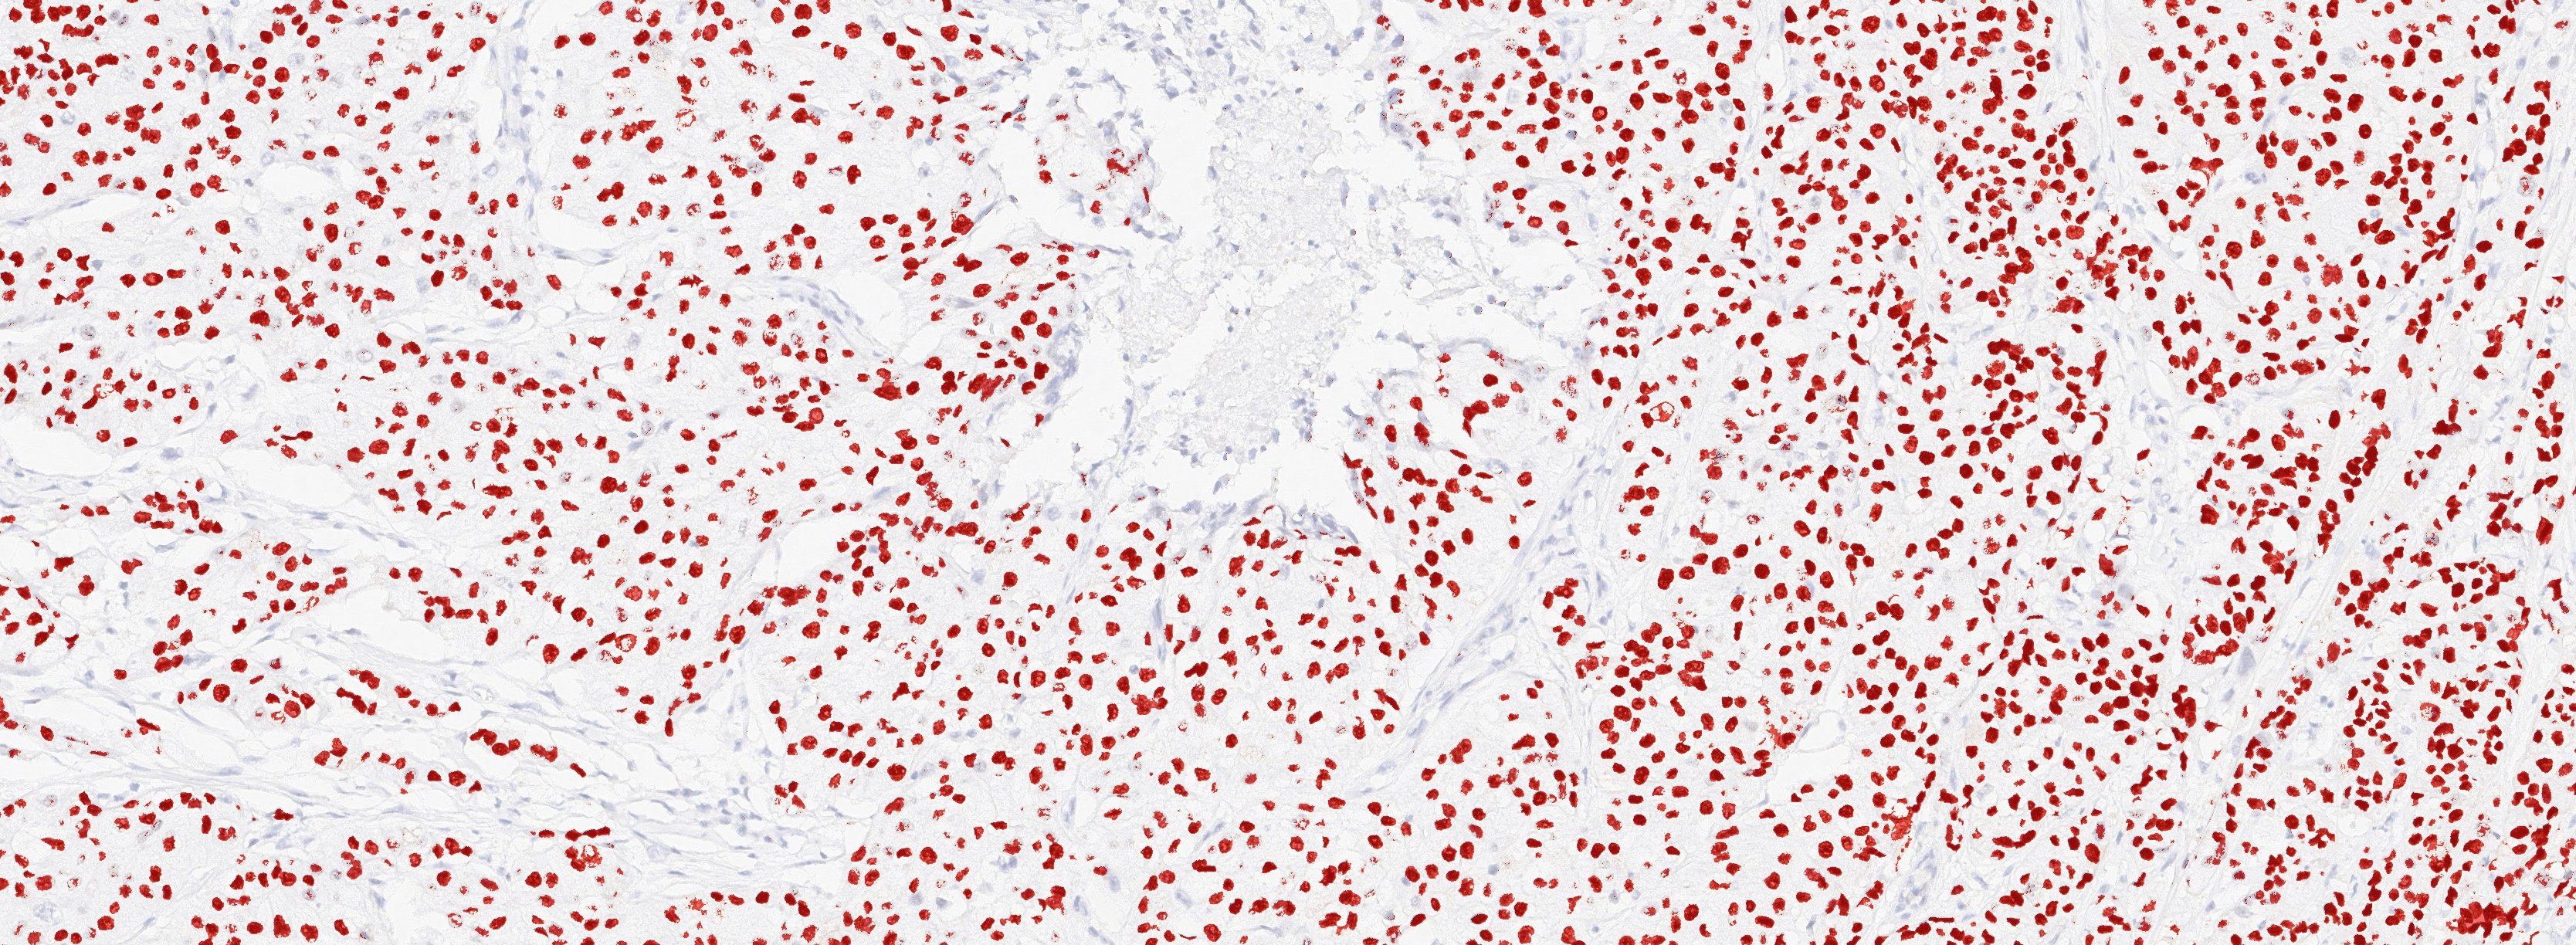
Figure 1A. Tissue section from biopsy of female patient diagnosed with invasive ductal adenocarcinoma, stained for estrogen receptor (ER); Move slider to reveal segmentation of ER+ cells, which are highlighted in red.
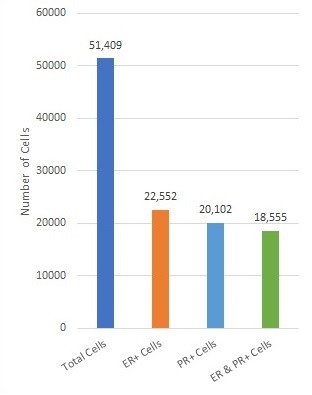
Figure 1B. Total number of cells, number of ER+, PR+, and ER+ & PR+ cells detected in a breast cancer section.
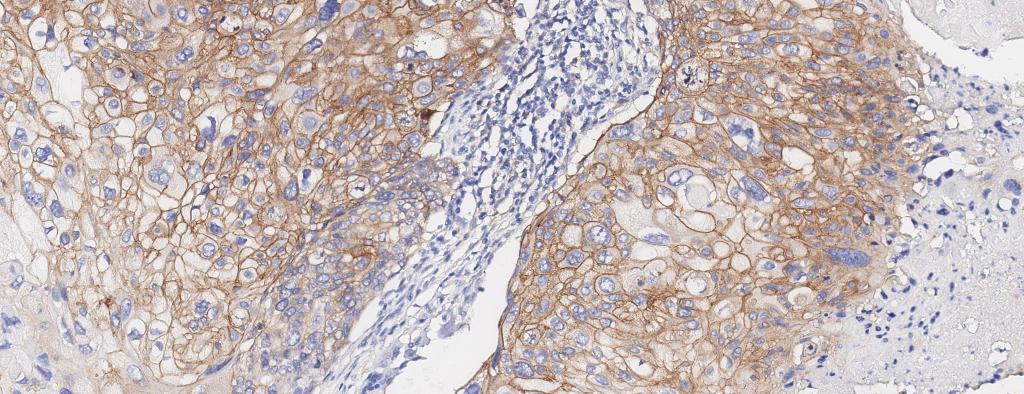
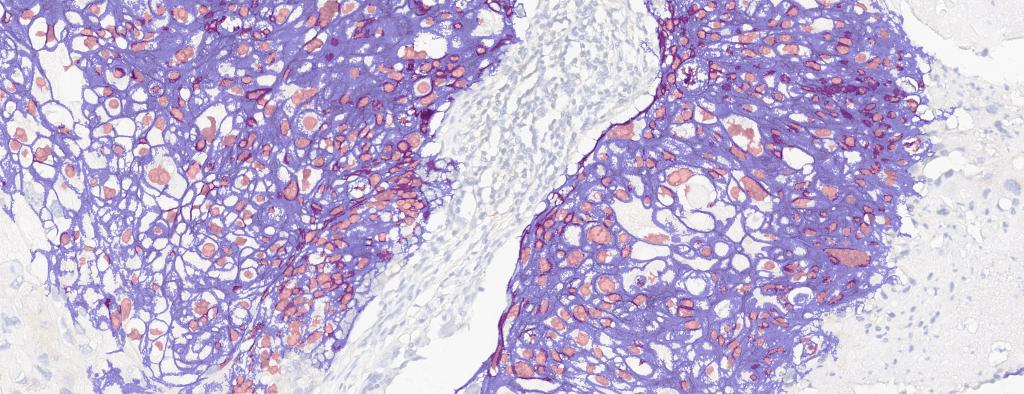
Figure 2. Breast cancer biopsy section from 50 y/o female patient with metastatic invasive ductal adenocarcinoma, stained for EGFR. EGFR+ cells identified (drag slider to see segmentation of EGFR+ cells)
Quantification of Astrocyte Reactivity and Spatial Distribution in TBI-induced Rat Brain Tissue
Investigation of the activation of astrocytes within rat brain following mechanically induced severe traumatic brain injury (TBI) showed a significant increase in reactive astrocytes. Quantification of two parameters, the distance between neurons and nearest reactive astrocyte, and distance of reactive astrocytes to nearest blood vessel was conducted on rat brain sections labeled with GFAP. The average neuron-astrocyte distance found in control samples was consistent with reported results [2]. After mechanically induced traumatic brain injury, the distance between neurons and activated astrocytes was found to decrease in a significant manner. The astrocyte-blood vessel distance was found to increase due to increases to astrocyte activation and GFAP expression following TBI. A statistically significant increase in GFAP expression leading to a significant increase in the number of astrocytes detected following TBI, consistent with previously reported results [3].
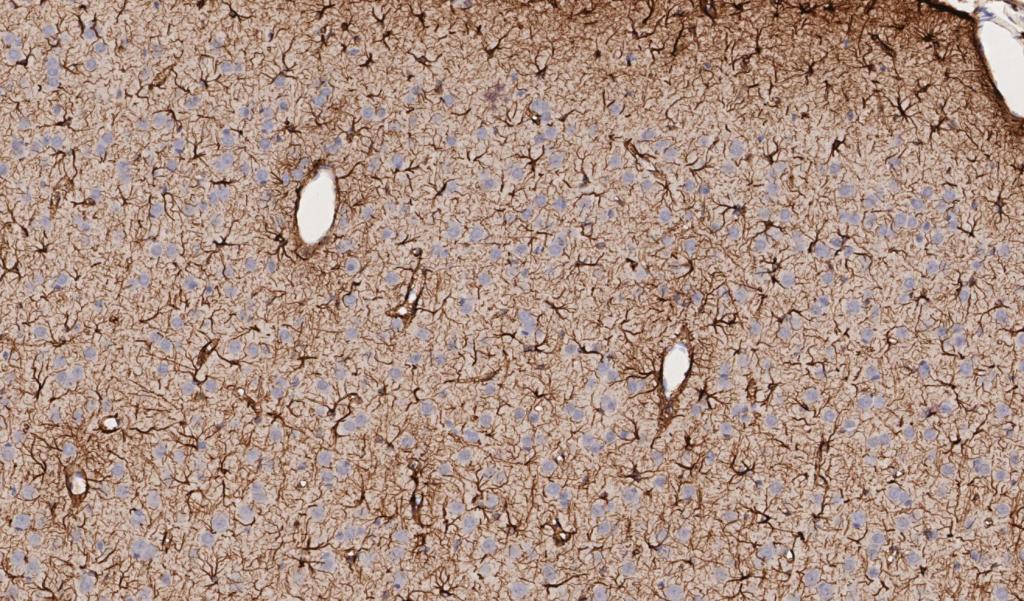
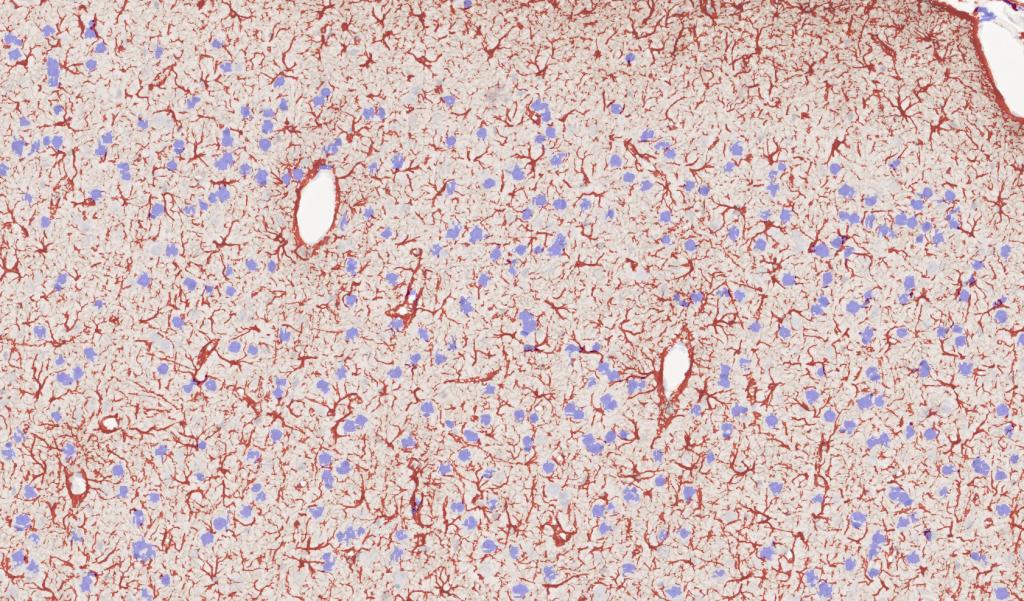

Figure 3. Rat brain exposed to severe traumatic brain injury (TBI) via mechanical insult; tissue section labeled with IHC for GFAP, drag slider to visualize segmentation depicting astrocytes in red, and neurons in blue. Violin plot depicts distribution of the intensity of GFAP labeling in TBI vs control brain tissue sections.
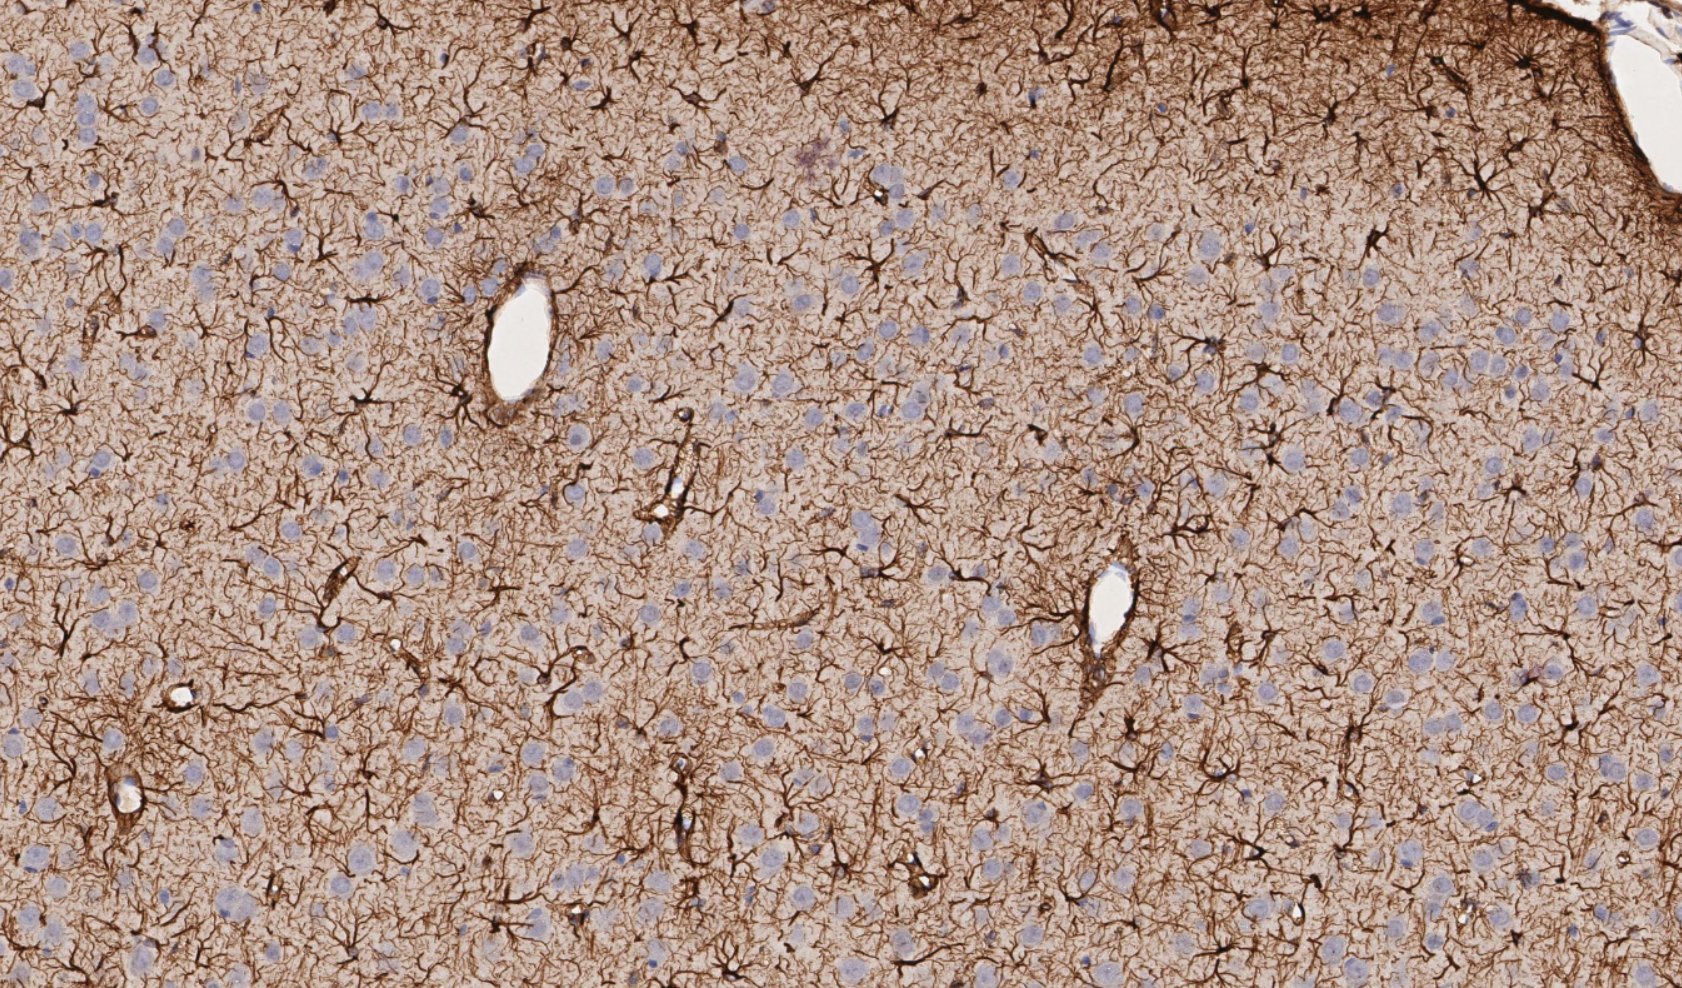
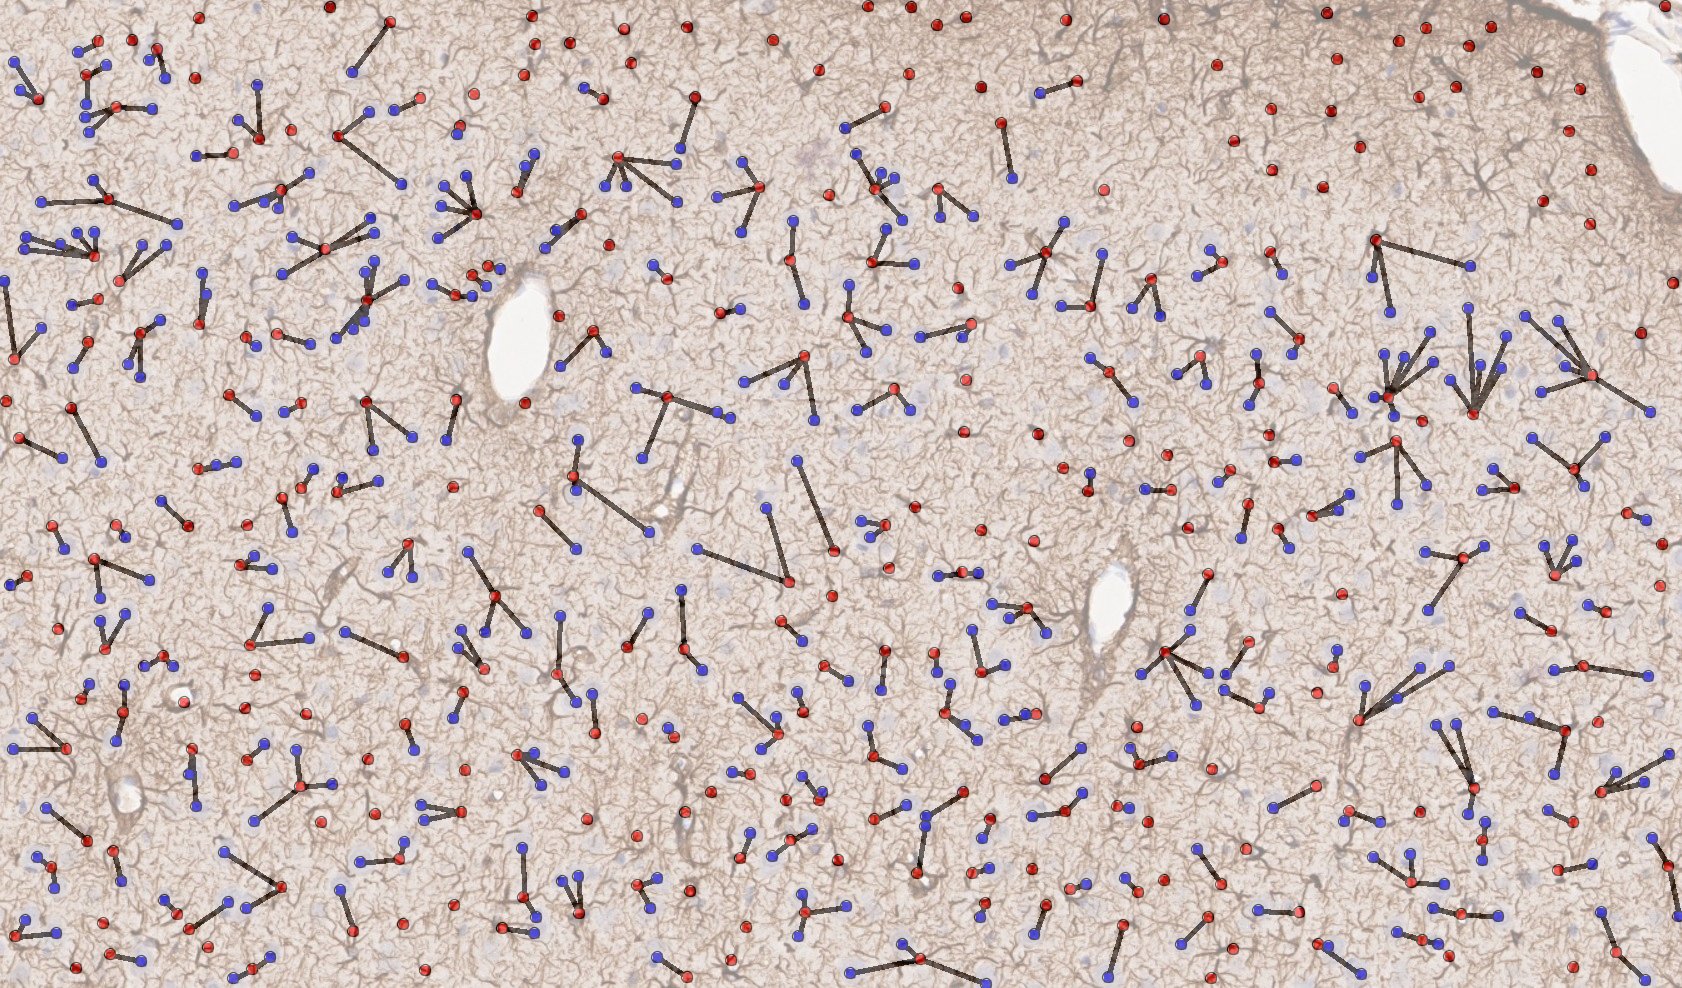

Figure 4. Mechanically induced TBI in rat brain; representative region of IHC tissue section labeled with GFAP and nuclei labeled with hematoxylin, drag slider to reveal graphical representation of nearest neighbor analysis used to assess neuron-astrocyte distances. Violin-plot depicts distribution of neuron-astrocyte distances in TBI (reactive astrocytes) and control brain tissue. There was a statistically significant decrease in the average distance between neurons and reactive astrocytes measured from GFAP labeled sections.
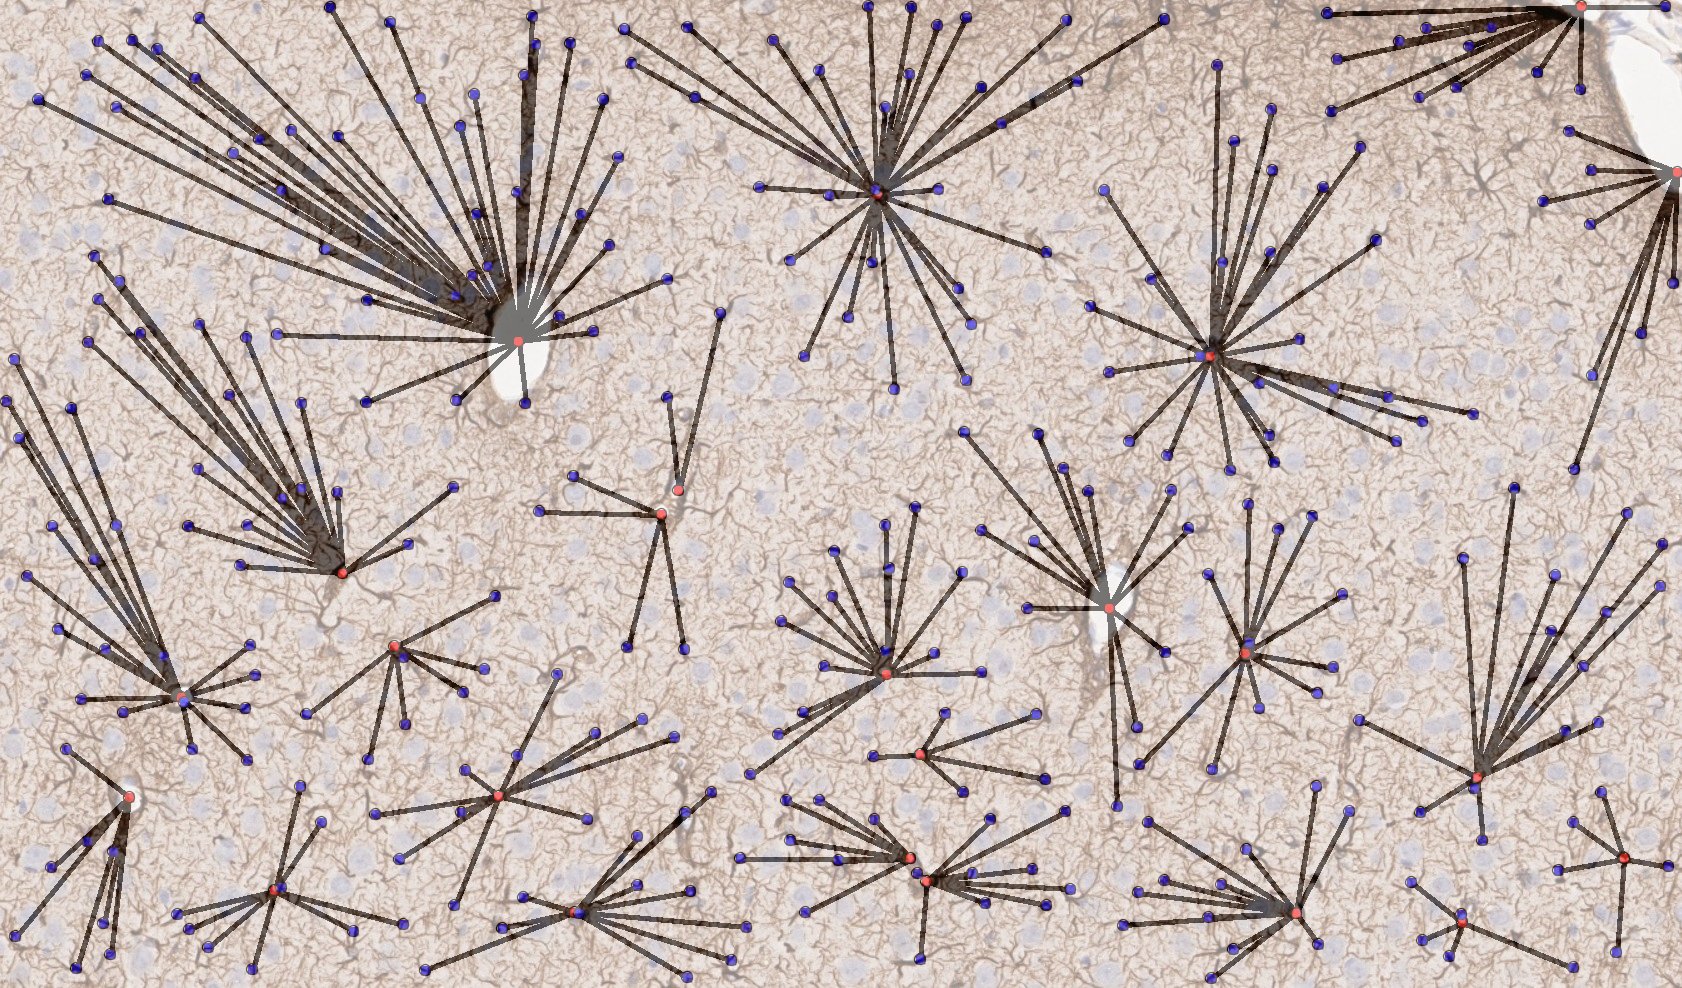

Figure 5. Mechanically induced TBI in rat brain; representative region of IHC tissue section labeled with GFAP and nuclei labeled with hematoxylin, drag slider to reveal graphical representation of nearest neighbor analysis used to assess astrocyte-blood vessel distances. Violin-plot depicts distribution of reactive astrocyte-blood vessel distances in TBI and control brain tissue. There was a statistically significant increase in the average distance between astrocytes and nearest blood vessel measured from GFAP labeled sections, likely due to increased GFAP expression following TBI due to astrocyte activation, leading to increased number of astrocytes detected by GFAP labeling distal from blood vessels.
References:
- Feldman, A.T., Wolfe, D. (June 2014). “Tissue Processing and Hematoxylin and Eosin Staining”. Histopathology. pp. 31-43.
- Distler, C., Dreher, Z., & Stone, J. (1991). Contact spacing among astrocytes in the central nervous system: an hypothesis of their structural role. Glia, 4(5), 484-494.
- Karve, I. P., Taylor, J. M., & Crack, P. J. (2016). The contribution of astrocytes and microglia to traumatic brain injury. British journal of pharmacology, 173(4), 692-702.
Available on: