Background
- Steatosis is the process describing the abnormal retention and accumulation of lipids within the liver, reflecting an impairment of the normal processes of synthesis and elimination of triglycerides. Excess lipid accumulates in vesicles that displace the cytoplasm; large accumulations of lipids can disrupt cell constituents, and in severe cases, the cell may even burst.
- Steatosis is a common consequence of hepatocellular insult, which can be drug-induced or can be an outcome in pathophysiogical disease progression.
- Phospholipidosis is a lysosomal storage disorder characterized by the excess accumulation of phospholipids in tissues, often stimulated by drugs.
- Drug induced hepatotoxicity is a leading cause of attrition during drug development. Since they better recapitulate the complex microenvironment of liver tissue, in vitro three-dimensional (3D) cell cultures provide a better predictor of the toxicological profile of drug compounds in vivo than traditional 2D monolayer cell models.
- 3D cell models permit long term compound exposures allowing a closer replication of clinical dosing strategies.
- Using High Content Screening with 3D cell models offers a medium-throughput approach to screening test compounds for their potential to induce steatosis.
Protocol
| Instrument | Molecular Devices ImageExpress Micro Confocal |
| Analysis Method | High content screening |
| Markers | LipidTox for lipid accumulation (Nile Red also available) LipidTox phospholipid stain DAPI (total cell count) |
| Cell Types Available | HepaRG (with and without non-parenchymal cells), HepG2, primary hepatocytes (with and without non-parenchymal cells) |
| Test Article Concentration | 8 point assay (0.05, 0.1, 0.5, 1, 5, 10, 50, 100 µM) (custom concentrations available) |
| Number of Replicates | 3 replicates per concentration |
| Time point(s) | 48 hr, 7 day, or 14 day (other time points available on request) |
| Quality Controls | 0.5% DMSO (vehicle control) Oleic acid (positive control) |
| Test Article Requirements | 150 µL of a DMSO solution to achieve 100x Cmax (200x top concentration to maintain 0.5% DMSO) or equivalent amount in solid compound. |
| Data Delivery | Dose response curves, AC50 values and minimum toxic concentration (or minimum effective concentration if measuring steatosis inhibiting drugs) |
General Procedure
- 3D liver cell models grown in ULA U-bottom plates; grown to approximately 200 μm in diameter
- Treatment with test compounds and controls
- At selected time points, 3D models are fixed and processed for fluorescent labeling
- 3D models are labeled with LipidTox to stain lipids and phospholipids, as well as with DAPI to label cell nuclei.
- High content imaging is conducted on well plates
- Images are analyzed to quantify lipids and phospholipids in cell models
Data

Figure 1. Z-projections of Z-stacks obtained from High Content Imaging of HepG2 spheroids treated with oleic acid. Data is quantified by automated image analysis to measure lipid accumulation.

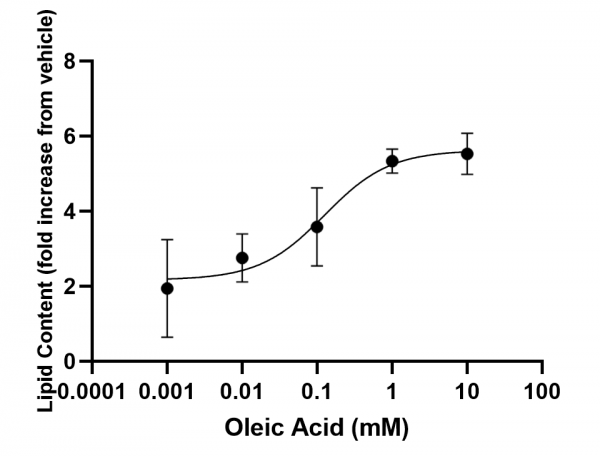
Figure 2. Representative data showing measured lipid accumulation as fold-increase over vehicle. AC50 value = 125.8 μM
