Background
- One of the leading causes of attrition during drug development is due to drug induced hepatotoxicity. Profiling the hepatotoxicity of test compounds on cell monolayers or 3D cell models involves measuring several parameters associated with liver toxicity in vitro, a critical step in any drug discovery campaign.
- Assaying the effect on cell viability provides an overall measure of hepatotoxicity, however does not uncover specific mechanistic aspects of drug toxicity. Mechanistic toxicity can be assayed by evaluating the effect of a drug on cell models for specific endpoints, such as reactive oxygen species generation, steatosis and phospholipidosis, cholestasis, fibrosis, mitochondrial toxicity, and glutathione depletion, which are key mechanisms of drug induced hepatotoxicity.
- In traditional monolayer models, HepG2 cells (and HepaRG cells) are frequently utilized to assess hepatotoxic effect of test compounds.
- In vitro 3D cell culture models allow better recapitulation of the complex in vivo microenvironment than traditional 2D monolayer models. Our hepatotoxicity assays are available using 3D cell culture models using HepG2, OpenLiver™ HepaRG 3D cell models, OpenLiver™ HepaRG NP hepatocyte/nonparenchymal cell co-culture 3D cell models, and primary human hepatocyte 3D cell models.
- Hepatotoxicity endpoints can be adapted to meet specific customer requirements.
Protocol
| Instrument | Molecular Devices ImageExpress Micro Confocal |
| Analysis Method | High content screening |
| Toxicity Markers | Cell viability Apoptosis Reactive oxygen species generation Steatosis and phospholipidosis Cholestasis Fibrosis Mitochondrial function Glutathione depletion |
| Cell Models Available | Monolayer format: HepG2, HepaRG, primary human hepatocytes 3D cell culture model format: HepG2 OpenLiver™ HepaRG 3D cell models OpenLiver™ HepaRG NP hepatocyte/nonparenchymal cell co-culture 3D cell models Primary human hepatocyte 3D cell models Primary rodent hepatocyte 3D cell models Custom models available on request |
| Test Article Concentration | 10 point assay (custom concentrations available) Single point assay |
| Number of Replicates | 3 replicates per concentration |
| Time points | Monolayer models: 24 h, 48 h 3D cell models: 24 h, 48 h, 7 days, 14 days Other time points available on request |
| Quality Controls | 0.5% DMSO (vehicle control) L-buthionine sulfoximine, rotenone (positive controls) |
| Test Article Requirements | 150 µL of a DMSO solution to achieve 100x Cmax (200x top concentration to maintain 0.5% DMSO) or equivalent amount in solid compound. |
| Data Delivery | Minimum effective concentration (MEC) and AC50 value for each measured parameter Dose response curves, heatmaps normalized to Cmax (if available) Evaluation of statistical significance of results with respect to vehicle and positive control |
General Procedure
- For 3D cell models, grown to approximately 200 μm in diameter. Adherent monolayers cultured to confluence.
- Treatment with test compounds
- Labeling with fluorescent probes
- For 3D cell models, tissue clearing is applied to render 3D cell models transparent
- High content imaging is conducted on well plates
- Images are analyzed to quantify assay endpoints
Representative Data

Figure 1. Maximum Z-projection of Z-stack obtained from High Content Imaging of OpenLiver HepaRG/NP 3D cell models treated with acetaminophen. Red: Mitochondrial function probe; Green: cell viability probe

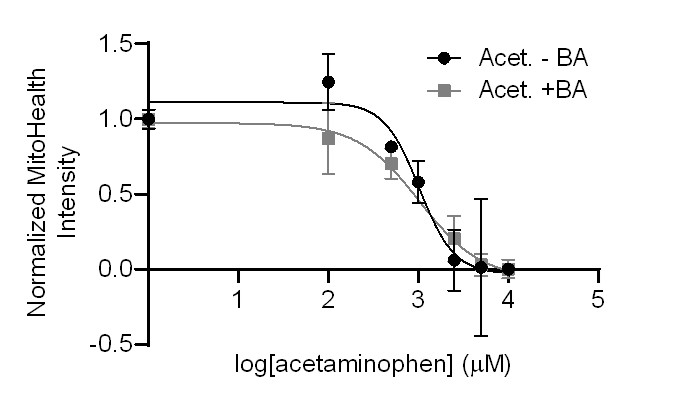
Figure 2. Dose-response curves indicating mitochondrial health in Visikol OpenLiver HepaRG/NP 3D models treated with acetaminophen (Acet.) with or without bile acid media (+/-BA) for 7 days.

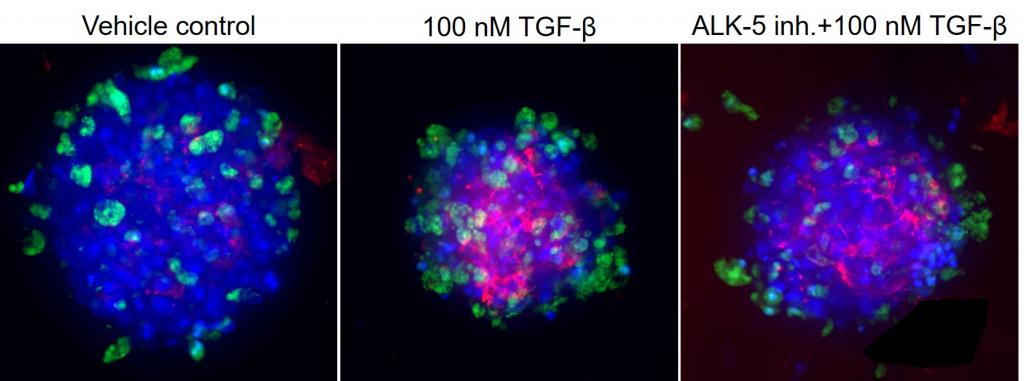
Figure 3. Visikol OpenLiver HepaRG/NP 3D spheroids were pretreated with either vehicle or an ALK-5 inhibitor for 1 h prior to inducing fibrosis with 100 nM TGF-β for 48 h. DAPI in blue, viability indicator in green, pan collagen in red.

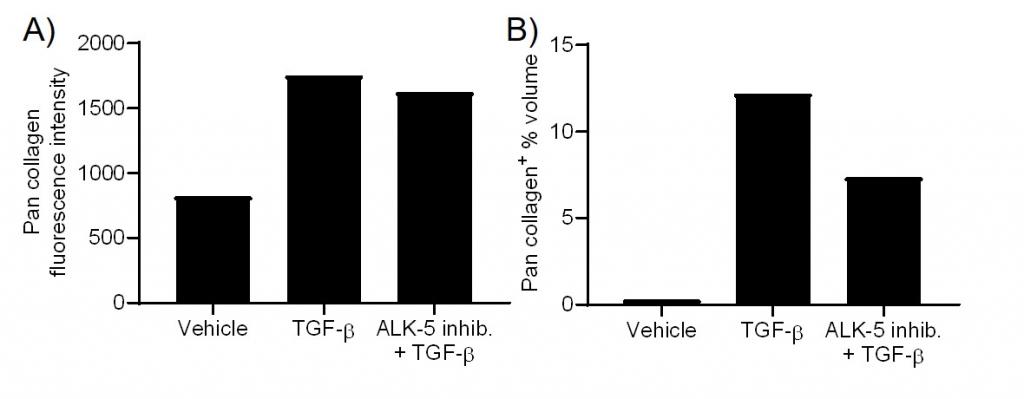
Figure 4. Visikol OpenLiver HepaRG/NP 3D spheroids were either pretreated with vehicle or an ALK-5 inhibitor for 1 h prior to inducing fibrosis with 100 nM TGF-β for 48 h. Collagen fluorescence intensity (A) and collagen volume fraction (B) was quantified for each condition.
