This particular blog post provides a comprehensive walk-through of the image analysis workflow utilized for The Antibody Penetration Assay. This assay is designed to measure the ability of therapeutic antibodies to penetrate tumor tissues, which is a critical factor in determining their effectiveness. The Antibody Penetration Assay is performed using 3D cell culture models, which closely mimic the in vivo environment of human tissue. These models are typically spheroids, which are composed of single or multiple cell types and have a more complex structure than traditional 2D cell cultures. The spheroids are treated with therapeutic antibodies at varying concentrations over time and then imaged using high-resolution microscopy.
3D Cell Model Analysis
The case below showcases the analysis of a 3D cell model, infused with D3 400 ng of Integrin. The spheroid was captured at 10X magnification (0.65 um/pixel), with a z-step size of 10um, using channels 405 and 488 to acquire the DAPI and antibody channels, respectively. Although the entire z-stack of the cell cluster is readily available, the current antibody penetration analysis is exclusively performed on the centermost slice of the 3D-image stack (as illustrated in Figures 1 and 2).
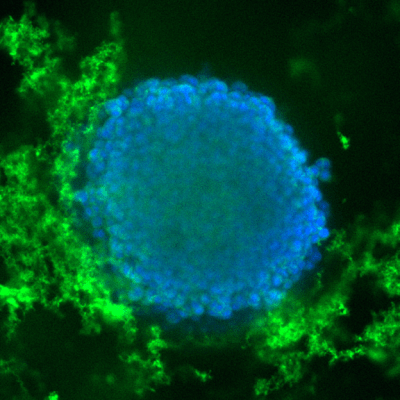
Figure 1 : A composite image of the centermost z-slice, with DAPI (nuclear stain) highlighted in a blue shade, and Integrin displayed in a vibrant green hue.
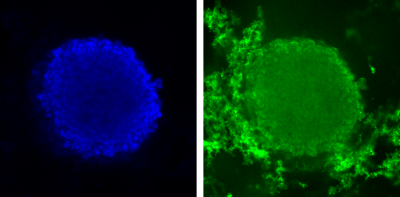
Figure 2: DAPI channel on the left and the Integrin channel on the right, both showcasing the centermost z-slice.
Determining the Boundary of the Spheroid
Before measuring the antibody channel, it is imperative to accurately determine the boundary of the spheroid. This is skillfully achieved by generating a mask of the spheroid through thresholding of the DAPI channel, as depicted in Figure 3. Once the boundary is determined, concentric rings traveling towards the center of the spheroid can be generated. These rings are binned by a 10um step size and applied to the antibody channel; the mean intensity is measured for each concentric ring (Figure 4). By displaying the mean intensity as a function of depth into the spheroid (as exemplified in Figure 5), one can estimate an approximate penetration depth. For this low dose, it is observed that the majority of the signal is present at a depth of 20uM, tapering into ~50uM deep into the spheroid before leveling out.
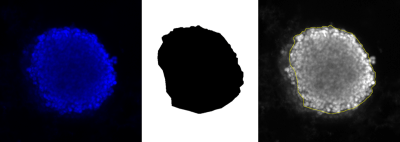
Figure 3: The boundary of the spheroid is generated by creating a mask (center) of the DAPI channel (left). The boundary is shown on the grayscale DAPI image in yellow (right).
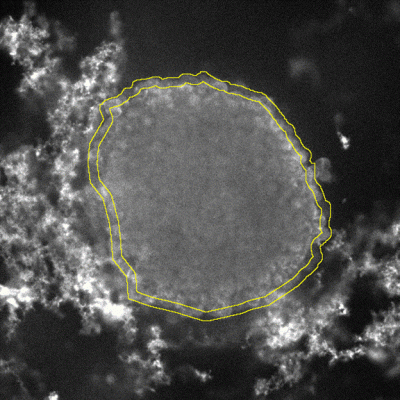
Figure 3: The boundary of the spheroid is generated by creating a mask (center) of the DAPI channel (left). The boundary is shown on the grayscale DAPI image in yellow (right).
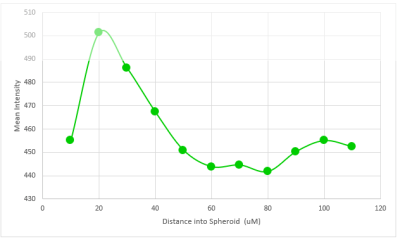
Figure 5: Result of the antibody penetration measurement, where the mean intensity is observed as a function of depth into the spheroid.
Overall, the Antibody Penetration Assays a valuable tool for researchers and drug developers, as it provides a reliable method for evaluating the penetration of therapeutic antibodies into tissue. With the support of companies like Visikol, the APA has the potential to revolutionize the field of drug development and lead to more effective treatments for a wide range of diseases. If you have questions about The Antibody Penetration Assay, or specific questions pertaining to the image analysis workflow, reach out today!
