Background
- Drug-induced liver injury (DILI) continues to be a major hurdle facing drug discovery and is the reason for over a quarter of the drugs that fail clinical studies due to toxicity.
- A major goal during the drug discovery pipeline is to ensure that researchers fail drugs with toxic liabilities earlier during the drug discovery process in order to reduce costs and to accelerate the overall process.
- While primary human hepatocytes (PHHs) in a 2D monolayer culture have been the traditional pathway for liver in vitro models, there are clear limitations to their capabilities, mainly cell viability and overall functionality.
- Visikol has established a partnership with Corning through which it offers its Clients drug induced liver injury (DILI) assay services that leverage Corning’s portfolio of validated primary human hepatocyte derived spheroids.
- These unique and well characterized liver spheroids are capable of better predicting DILI when compared to traditional 2D monolayer assays and provide researchers with a bio-relevant and high-throughput assay format.
- Corning’s extensive studies comparing their 3D models to traditional 2D models has shown that using these 3D models in DILI studies results in better predictability of toxic liabilities when compared to traditional 2D studies.
Protocol
| Instrument | ThermoFisher Varioskan LUX Plate Reader or high content imaging (Molecular Devices ImageXpress, ThermoFisher CellInsight CX7 LZR) |
| Analysis Method | Plate reading High content imaging available upon request for additional endpoints |
| Toxicity Markers | Primary Marker: Total ATP High content imaging markers: · Cell viability · Apoptosis · Reactive oxygen species generation · Steatosis and phospholipidosis · Cholestasis · Fibrosis · Mitochondrial function · Glutathione depletion |
| Cell Models Available | Primary human hepatocytes only Primary human hepatocytes and non-parenchymal cells HepaRGs and non-parenchymal cells Other models and custom models available upon request |
| Test Article Concentration | 8 point assay (custom concentrations available) |
| Number of Replicates | 3 replicates per concentration |
| Time points | Monolayer control models: 24 h after dosage 3D cell models: 3 dose points over two weeks Other time points available on request |
| Quality Controls | 0.1% DMSO (vehicle control) Category 1-3 DILI drugs (positive controls) |
| Data Delivery | Dose response curves, IC50 and margin of safety |
Representative Data
Using the Corning 3D PHH spheroid models in a 100 compound screen, it was shown that the 3D PHH spheroids with repeated dosing were more sensitive than 2D monolayer culture of the same donor lot of PHH in detecting compounds within DILI categories 1 to 3 (severe, high clinical DILI concern and low clinical DILI concern) when using an MOS threshold at 50 times Cmax, i.e. MOS 50. In many cases, 2D monolayer cultures failed to detect liver toxicity of these tested DILI compounds. For DILI categories 4 and 5, however, we observed increased false positive by PHH spheroids in comparison to the 2D monolayer cultures as more MOS values for 3D spheroids fell below the MOS 50 threshold. As shown in Table 1, the choice of MOS threshold impact both sensitivity and specificity of the toxicity assays as more stringent criteria of MOS 10 and 30 reduced the false positive calls observed in 3D toxicity test while the specificity calls are still better than that of 2D assays. Compared to 2D monolayer cultures, 3D PHH spheroids are 2-3 times more sensitive (i.e. sensitivity of 61% for 3D PHH spheroids vs 26% for 2D PHH monolayer) in detecting hepatotoxicity induced by DILI categories 1-3 compounds. A recent report by Proctor et al also showed a similar improvement in assay sensitivity for 3D vs 2D PHH culture.

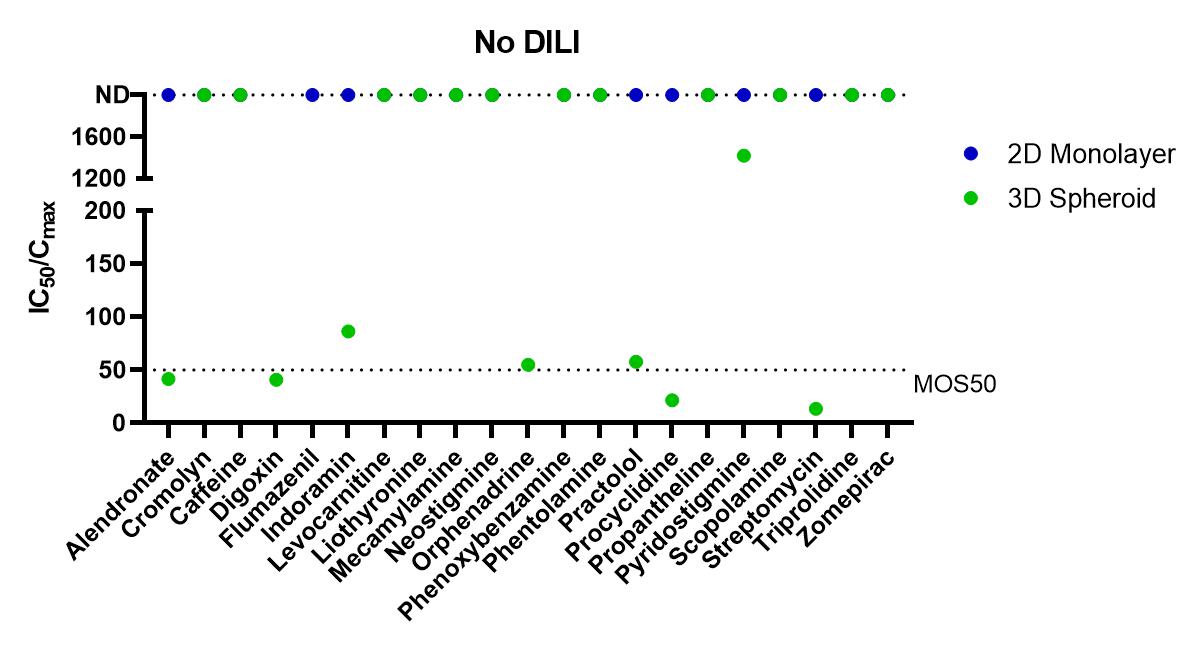
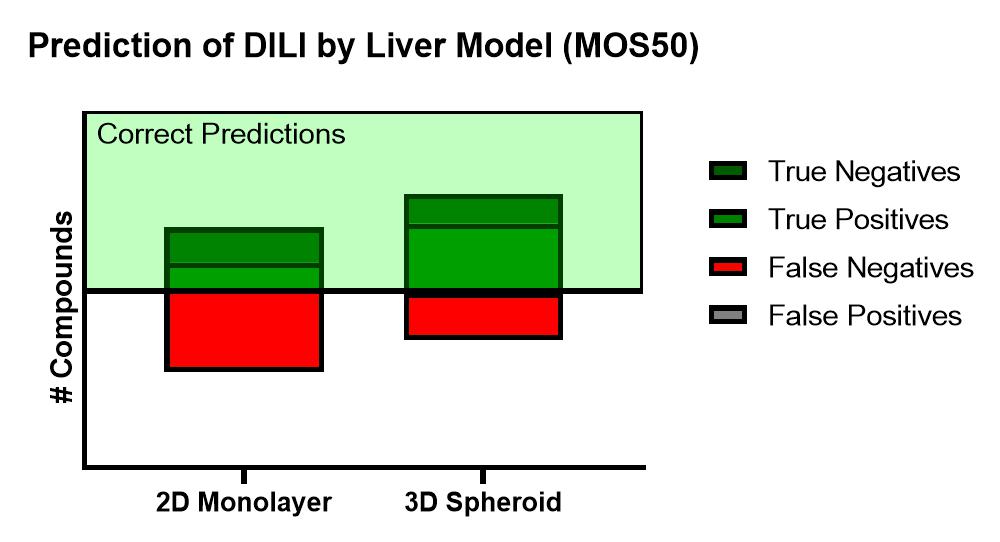
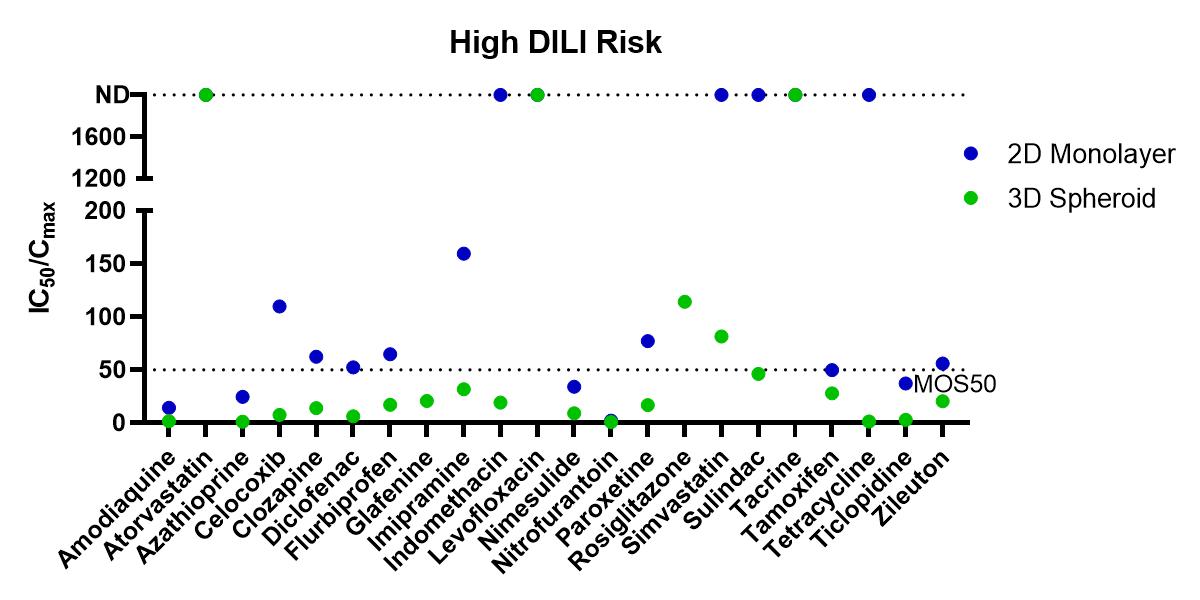
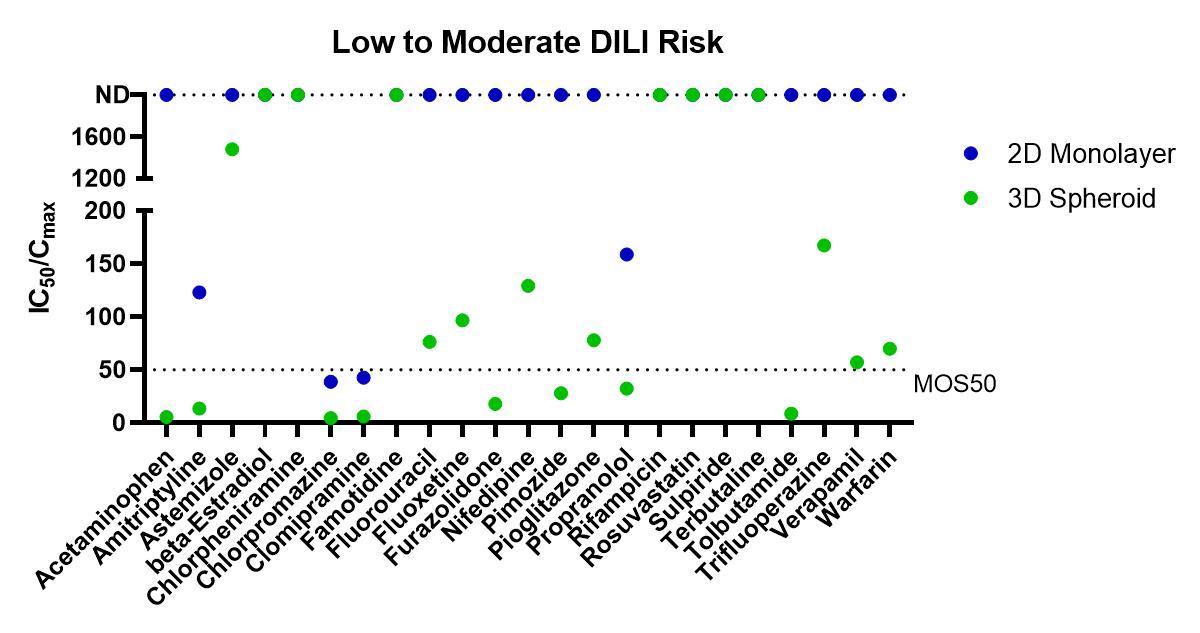

Figure 1. Summary of Margin of Safety (MOS, i.e. the ratio of IC50 and Cmax) values from in vitro toxicity tests. The dotted line indicates MOS at 50, one of the thresholds used to score the positive or negative detection of liver toxicity for each tested compound. From left to right are separate graphs for compounds within each DILI category 1, 2 and 3. Control compounds within DILI categories 4 and 5 are graphed together. For compounds with no detection (ND) of toxicity within the tested concentration ranges, IC50/Cmax ratio were plotted on top of the graph at 2000.
