Background
- Non-alcoholic fatty liver disease (NAFLD), which originates from disordered lipid metabolism attributed to the activation of de novo lipogenesis from high sugar diets, affects 20-50% of the population (1). The consequential hepatocellular accumulation of lipid droplets (steatosis) can lead to enlargement of the liver which, in non-alcoholic steatohepatitis (NASH), is accompanied by inflammatory events that form the basis for fibrosis and liver damage (1,2).
- In later phases of NAFLD, steatosis induces inflammatory events, which in turn lead to the activation of Kupffer cells and hepatic stellate cells (HSCs) (3). More specifically, the transition of HSCs from a quiescent to proliferating, fibrogenic, myofibroblast-like phenotype is facilitated by cytokines such as PDGF, TGFβ, and IL-1 that are released by already damaged HSCs or by infiltrating immune cells. Left unchecked, the extracellular matrix remodeling events facilitated by HSCs in fibrotic stages of the disease can impair normal liver functionality and lead to cirrhosis (4,5).
- Given the differences in how humans versus animal models manifest liver disease, in vitro models are increasingly being used in the development of therapeutics to prevent or treat fibrosis.
- Given the necessary interplay of multiple cell subtypes in fibrogenesis, 3D cell culture models which incorporate a mixture of hepatocytes or hepatocyte-like cells with nonparenchymal cells (NPCs) provide the greatest utility.
- Analysis of gene expression via qPCR allows for many genes of interest to be evaluated using a single sample and inclusion of additional endpoints (e.g. ELISA, immunofluorescent labeling) can lend itself to even greater understanding of the pathogenesis of fibrosis.
Liver Fibrosis Model Workflow
Plate Cells
(1-2 hours)

Spheroid Formation
(14 days)
Treatment
(72 hours)
Endpoint Assays
(1-2 weeks)
&
Analysis
(1-2 weeks)


Report
General Procedure
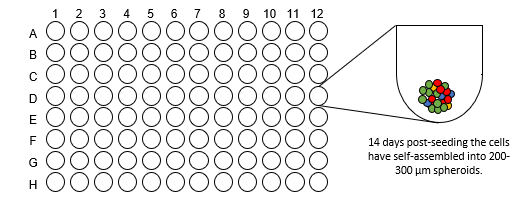
- For generation of liver spheroids, 1500 cells/well (60% hepatocytes, 40% NPCs) are seeded into ULA U-bottom plates and maintained under standard culture conditions for 14 days to enable spheroid aggregation to a size of approximately 200 μm in diameter.
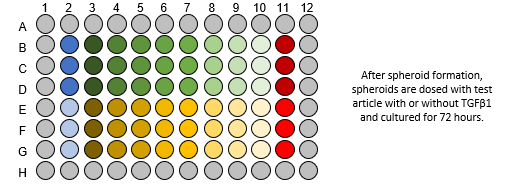
- Spheroids are treated with test compounds. If test compounds are intended to ameliorate rather than prevent fibrosis, test compounds will be added after induction of fibrosis.
- Following 1 h of pre-treatment (other timepoints available upon request), fibrosis is induced via addition of 100 ng/mL TGF-β for an additional 72 hours. Test article concentration is maintained through induction of fibrosis.
- Following treatment, liver spheroids are collected and pooled, and the RNA is extracted. This RNA is then utilized in downstream qPCR to assess genes of interest.
a) If immunofluorescent labeling is also elected:
i) Select spheroids are labeled with a viability dye, fix and then labeled with antibodies against pan-collagen and α-smooth muscle actin.
ii) Tissue clearing is applied to render liver spheroids transparent.
iii) High content imaging is conducted on well plates.
iv) Images are analyzed to quantify the relative florescent intensity of α-SMA, % volume of collagen deposited, and viability.
b) If cytokine or ELISA endpoints are elected:
i) Supernatant is collected and stored at -80°C until processed.
Protocol
| Data | Molecular Devices ImageExpress Micro Confocal |
| Analysis Method | High content screening |
| Markers | Pan collagen (collagen I, IV, V or others available as an alternative or addition) Alpha-SMA (stellate cell activation marker) Live/Dead stain (viability indicator) DAPI (total cell count) |
| Cell Types Available | Standard:
Other options:
Other/custom liver models available upon request. |
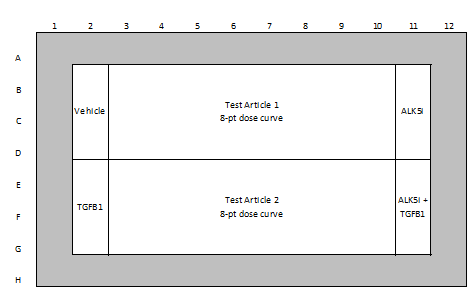
| Test Article Concentration | 8-point assay (0.05, 0.1, 0.5, 1, 5, 10, 50, 100 µM) (custom concentrations available) |
| Number of Replicates | 3 replicates per concentration |
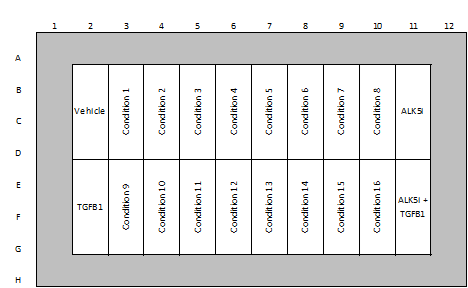
| Plate Format | Standard:
Optional: 96-well ULA high density spheroid forming plate (inner 60 wells, approximately 80 spheroids per well) |
| Quality Controls | 0.5% DMSO (vehicle control) ALK-5 inhibitor (negative control) TGFβ (positive control) |
| Test Article Requirements | 50 uL of 20 mM solution or equivalent amount of solid |
| Endpoints | Basic:
Basic+:
Add-Ons:
|
| Data Delivery | Dose response curves and EC50 values for select genes of interest in response to anti-fibrotic agents. |
Example of Plate Layouts
