
Precision-Cut Liver Slice Assay Endpoints

One of the major advantages of utilizing precision-cut tissues for drug discovery research is the ability to obtain myriad endpoints in a single study. Our in-house capabilities include histological sectioning and staining, gene expression (qPCR), protein expression, quantitative image analysis, and 3D confocal imaging of cleared whole precision-cut tissue slices. The ability to simultaneously measure such a wide variety of endpoints is one of the most significant advantages of this assay format.
Histology
Precision-cut liver slices (PCLS) can easily be embedded in paraffin for sectioning and visualization using all conventional histological stains. The PCLS are thick enough (200-500 microns) to obtain at least 10-15 five-micron sections for each PCLS.
- Hematoxylin and Eosin (H&E)
- Masson’s Trichrome
- Special stains available on request (e.g. PAS, nile red)
- Immunostaining (Immunofluorescence or conventional chromogenic IHC), with suite of validated antibodies (custom antibodies available on request)
- Fluorescence in situ hybridization
Representative examples:


Whole Mount Labeling
Leveraging our unique expertise in tissue clearing and 3D confocal imaging, precision-cut liver slices can be immunolabled, cleared, and imaged while intact within well-plates. This allows quantitative interrogation of cell population and protein expression in 3D and at a high level of detail.
- Immunolabeling (pre-validated targets for cell markers, collagen, aSMA, and others. Custom markers available on request)
- Lipid droplet staining
- Cell population quantification
- Immune cell profiling
Representative examples:


Quantitative Image Analysis
Coupled with slide-scanning or fluorescent microscopy, quantitative image analysis is a powerful tool to assess cell populations, cellular phenotypes, and protein expression within precision-cut liver slices. As leaders in the field of quantitative image analysis, we utilize custom-built image processing pipelines to extract a wide variety of useful endpoints from image data.
- Cell counting
- Relative protein content (e.g. α-SMA)
- Collagen deposition
- Collagen fiber analysis
- Lipid droplet quantification
- Immune cell profiling
- Stellate cell activation
- Cytokine release localization
- Receptor profiling (e.g. PDFGR-β)
- Custom endpoints available
Representative Examples:


Gene Expression
Using RT-qPCR, the expression levels of genes of interest in precision-cut liver slices can be quantified, allowing for highly sensitive detection of drug effects. RNA can be extracted at microgram levels from individual precision-cut liver slices and used in subsequent analyses. For a higher number of targets, or low-expressing targets, we recommend pooling 2-3 precision-cut liver slices for RNA extraction.
We also partner with 3rd party suppliers to provide RNAseq from RNA extracted from precision-cut liver slices, and can return extracted RNA to you for further studies.

Representative RNA levels from total RNA extraction of precision-cut liver slices (left). Typical extractions yield 1-2 micrograms of RNA, and typical RT-qPCR runs utilize 10 ng. Highly pure RNA was obtained as measured by 260/280 nm ratio (right).
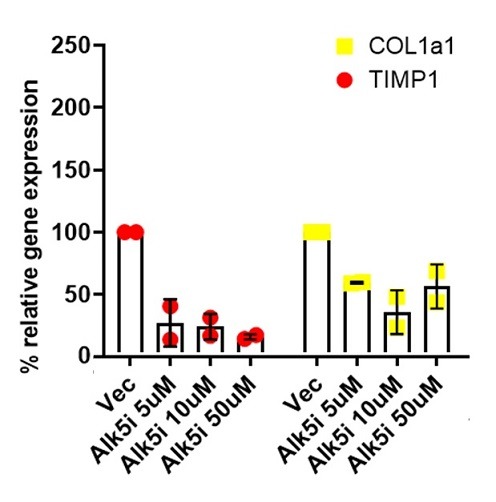
Representative RT-qPCR results from precision-cut liver slices treated with ALK5 inhibitor (ALK5i) and untreated control. ALK5i treatment caused statistically significant reduction in TIMP1 and COL1a1 RNA levels.
Protein Expression
Using conventional enzyme-linked immunosorbent assays (ELISA), we can quantitatively assay protein content in media supernatant or in digested precision-cut liver slices.

Endpoint Compatibility Table
Most endpoints can be obtained from each precision-cut tissue slice, but some endpoints are mutually incompatible if they require digestion/extraction of the precison-cut slice. For instance, whole-mount labeling is incompatible with RT-qPCR and ELISA on digested tissue, since the sample must be consumed for RT-qPCR and digestion. Please note: within a study, a slice may be divided, for instance, such that half of the slice is used for whole mount labeling, and the other half used for RT-qPCR.
| Whole Mount | Histology | RT-qPCR | ELISA (secreted) | ELISA (digest) | |
|---|---|---|---|---|---|
| Whole Mount | — | ||||
| Histology | — | ||||
| RT-qPCR | — | ||||
| ELISA (secreted) | — | ||||
| ELISA (digest) | — |
