Highlights
3D liver fibrosis models typically incorporate both hepatocytes and various non-parenchymal (NPC) populations. Stimulation of these models using TGFβ1 can induce a fibrosis-like effect whereby the stellate population is activated and begins to deposit collagen. By modifying NPC populations within a liver spheroid model, we demonstrate differences in stimulation effect based on cell subtype proportions. Modulation of liver cell populations in in vitro models could be utilized to examine specific effects of therapeutics on cell populations of interest.
Introduction
Liver disease affects millions of people in the United States alone. Non-alcoholic fatty liver disease (NAFLD) is a sub-type of liver disease characterized by fat retention within the liver, a condition that affects 30–40% of U.S. adults. Of those with NAFLD, approximately 20% develop non-alcoholic steatohepatitis (NASH), wherein inflammation and cellular injury ultimately lead to the deposition of fibrotic tissue within the liver. Continued cell death and extra cellular matrix deposition can lead to cirrhosis and eventually liver cancer or liver failure.
NAFLD and NASH are of particular interest therapeutically because early stages of the disease are known to be reversible, though no approved therapeutics currently exist. There are few cell culture models available that are capable of imitating the liver in vitro, and since many historic candidate therapeutics have failed in late stage clinical trials, the development of a more predictive in vitro model of liver fibrosis represent an attractive approach to screening therapeutics earlier, in the preclinical phases of drug development. A crucial element in developing a model that can appropriately recapitulate NASH is understanding the interplay between various relevant cell types and working to accurately mimic their interactions in an in vitro model. There are many cell types that play a role in liver fibrosis, most notably, hepatic stellate cells. They become activated during inflammation and are the major player in collagen deposition. However, other cells including Kupffer cells, liver sinusoidal endothelial cells (LSECs), macrophages, and other immune related cell types also react to stimuli within the liver and release factors that can lead to and enhance stellate cell activation.
In this application note, modulation of cell subtypes within 3D liver spheroids is examined with and without TGFβ1 stimulation. Human hepatocytes are combined with Lonza purified donor-matched non-parenchymal cell (NPC) populations mixed in different ratios and compared to crude NPCs (other vendor). Immunolabeling of cell subtypes and collagen gives us insight into cell populations within the spheroid and the influence of TGFβ1 stimulation on these 3D liver fibrosis models, respectively.
Method
Spheroid formation and stimulation
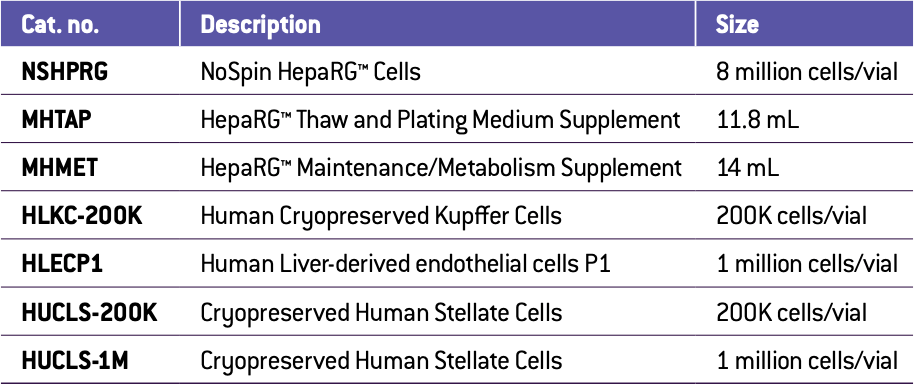
Human HepaRG™ No Spin hepatocytes (Lonza, NSHPRG) were mixed with human crude non-parenchymal cells (NPCs) or differing mixtures of Lonza donor matched human stellate cells (Lonza, HUCLS-200K), Kupffer cells (Lonza, HLKC-200K) or liver endothelial cells, (Lonza, HLECP1) at a ratio of 60 % hepatocytes to 40 % total NPCs. Varying ratios were used to find ideal combinations as noted in Figure legends. A total of 1,500 cells per well were seeded into a 96-well ultra-low attachment round-bottom plate (Corning, 4515). Initial culture occurred in William’s E medium supplemented with HepaRG™ Thaw, Plate & General Purpose Supplement (Thermo Fisher, HPRG770) and GlutaMax (Thermo Fisher, 35050061). Subsequent feedings and stimulation were done in William’s E medium supplemented with HepaRG™ Maintenance Supplement (Thermo Fisher, HPRG720) and GlutaMax (Thermo Fisher, 35050061). The cells formed spheroids over the course of a two-week preculture. At this point, the spheroids underwent a one hour pretreatment with a vehicle control or 5 μM ALK5 inhibitor (A 83-01, ApexBio, cat# A3133) and then 72-hours of treatment with 100 ng/mL of transforming growth factor beta 1 (TGFβ1) (R&D Systems, cat# 240-B) with or without the ALK5 inhibitor.
Immunolabeling, clearing and high content imaging of 3D liver spheroids
Spheroids were fixed, permeabilized, and blocked prior to primary antibody labeling. The spheroids were then washed, and secondary antibody and DAPI was added. Following another wash, the spheroids underwent dehydration in methanol to remove any water. The methanol was then removed and Visikol HISTO-M™ added prior to imaging using a Molecular Devices ImageXpress Micro Confocal high-content imaging platform.
Image processing and analysis
Briefly, spheroid volume was calculated by determining the spheroid area of each z-slice using the DAPI channel. Manual thresholding was conducted to select bright regions of collagen positive staining using pan-collagen. Thresholded area and integrated density (sum of intensities within region) were measured across the z-stacks, summed, and multiplied by the z-step (10 μm) to give the total volume or total integrated density within the spheroid. Results are reported normalized to spheroid volume.
Results and discussion
Incorporation of cell types of interest within a 3D liver spheroid model
The cell types present within the self-assembling liver spheroids were determined using immunolabeling specific for four cell types of interest: hepatocytes, stellate cells, Kupffer cells, and liver endothelial cells. As illustrated in Figure 1, all four cell types were found to be present within spheroids seeded with these cell types. Verification of the incorporation of cell types of interest within the spheroids is important to examining the effectiveness of self-assembly and to evaluate the effects of treatments.
Stimulation of spheroids with TGFβ1 results in increased collagen deposition for some NPC mixtures.
Human HepaRG™ hepatocytes were cultured with differing mixtures of human non-parenchymal cells (NPCs). These mixtures varied from crude fraction NPCs (other vendor), which have been separated from hepatocytes, but not separated into their separate cell types, to different combinations of donor-matched (Lonza) stellate, Kupffer and liver endothelial cells. (Note the crude NPCs are from a different donor than the matched subtypes, but a similar age). Examination of collagen deposition using immunolabeling for pan-collagen demonstrates some collagen deposition in all spheroids, regardless of subtype composition or treatment. However, collagen expression appears to be qualitatively higher in spheroids composed of a higher percentage of stellate cells when treated with TGFβ1 compared to control spheroids of the same type (Figure 2).
Conclusion
This data demonstrates the ability of different cell populations to come together to form 3D liver spheroids consisting of all relevant populations. Additionally, differences in cell subtype population within a model has varying effects on the model’s ability to react to stimulation. This is an important aspect to consider, as using purified populations of non-parenchymal cells may allow for modulation of 3D liver models for testing the influence of therapeutics on specific cell populations.

Figure 1. Max intensity z-projections of cell subtype labeling in a liver spheroid model consisting of 60% Lonza HepaRG™s and stellate cells, Kupffer cells, and liver endothelial cells at a 1:1:1 ratio. All four cell subtypes can be discerned through immunolabeling; hepatocytes with albumin, stellate cells with vimentin, Kupffer cells with CD68 and liver endothelial cells with CD31.
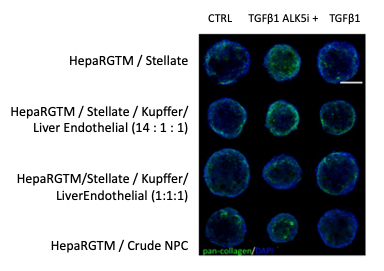
Figure 2. The middle slice of a confocal z-stack of spheroids seeded with differing mixtures of non- parenchymal cell populations under different treatment conditions. DAPI labels the nuclei (blue) and pan-collagen labels collagen (green). Scale bar: 100 μm
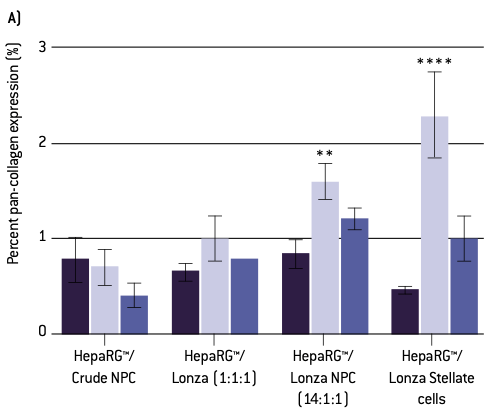
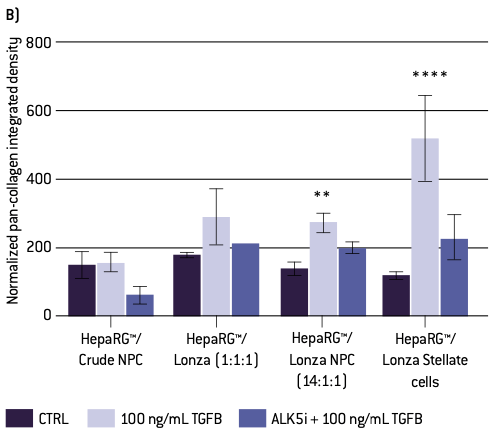
Figure 3. Quantitative analysis of pan-collagen staining. A) Percent pan-collagen expression and B) integrated density normalized to spheroid volume. Error bars represent standard error of the mean (SEM). A one-way ANOVA with a Dunnett post-hoc analysis was conducted to compare means of experimental groups to the control, while adjusting for multiple comparisons; one, two, three, or four asterisks indicate p < 0.05, 0.01, 0.001, 0.0001, respectively.
References
- [1] SpenglerEK,LoombaR.Recommendationsfordiagnosis,referralforliverbiopsy,and treatment of nonalcoholic fatty liver disease and nonalcoholic steatohepatitis. Mayo Clinic Proceedings. 2015;90(9):1233–1246.
- [2] KimK&KimKH.Targetingofsecretoryproteinsasatherapeuticstrategyfor treatment of nonalcoholic steatohepatitis (NASH).
Int. J. Mol. Sci. 2020;21(7):2296. - [3] DewidarB.etal.TGF-βinhepaticstellatecellactivationandliverfibrogenesis.Cells. 2019;8(11):1419.
- [4] AlukaJJ&ThuluvathPJ.ReversalofNASHfibrosiswithpharmacotherapy.Hepatology International. 2019;13:534-545.
Authors
Kathryn E. Worley1, Erin E. Edwards1, Maureen Bunger2, Thomas S. Villani1
1Visikol Inc, 53 Frontage Road, Shelbourne Building, Suite#120, Hampton, NJ 08827, 2 Lonza, Lonza Walkersville, Inc. – Walkersville, MD 21793

