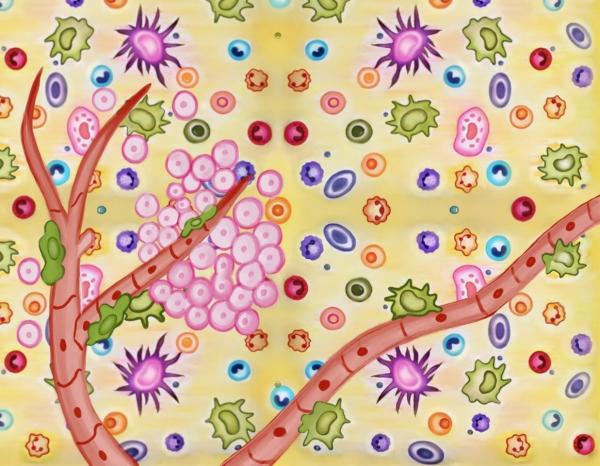
The tumor microenvironment is the intricate ecosystem that surrounds a tumor consisting of immune cells, extracellular matrix, blood vessels and feeder cells like fibroblasts. There is a constant interaction between tumor and its microenvironment, which plays an important role in tumor progression. Because of the rapid growth of tumor cells and their high metabolic demands, the tumor microenvironment also involves alterations and temporal fluctuations in the biochemical conditions within the tissue, such as hypoxia, low pH, and nutrient deprivation, which create additional demands on cells and impose a highly selective milieu. The composition of tumor microenvironment in one tiny area can be completely different from another area just 100 microns away. It may be possible to assess cancer risk and prognosis by identifying the location of biomarkers within the microenvironment. Spatial heterogenicity is a fundamental feature of tumor microenvironment.

Schematic representation of Tumor Microenvironment
Spatial Imaging
Spatial Imaging of the Tumor Microenvironment (TMI) has contributed a lot in understanding the Tumor suppressive nature of the TMI and aided in developing therapies, prognosis, and diagnosis of cancer. From these studies it’s evident that cancer cells have acquired an array of defense mechanisms. According to Courtney et al (2022) cancers present peptide epitopes in the context of MHC molecules that can be recognized by T cells, but tumor cells themselves do not present antigen, or may need additional signaling through costimulatory molecules, for T-cell activation and expansion. Tumor cells can also downregulate antigen expression by a variety of mechanisms, such as epigenetic silencing, loss of MHC expression, and loss of function of the intracellular machinery that processes and transports peptides to the cell surface. In addition to CTLA-4 signaling, negative signaling can also be transduced through PD-1. Dendritic Cells found within the tumor microenvironment have been shown to express high levels of PD-L1, which contribute to decreased local T-cell function. Blockade of this PD-L1/PD-1 interaction using decoy receptors or antibodies is effective in improving immune therapies. Studying all these intricate interactions happening in a tumor microenvironment in a spatial context is becoming more and more relevant to understand the efficacy of therapy or resistance towards it.
Histology and imaging are excellent resources for obtaining tumor spatial structure in large quantities for studying extensively cancer immunotherapies. Such spatial data, once quantitatively analyzed, will aid in the identification of clinically relevant features, thereby yielding predictions more accurate and insightful than measurements of cell abundance that ignore the spatial context. With appropriate methodologies, imaging and analysis of tumor sections can reveal the spatial context of cancer–microenvironment interactions at single-cell resolution, these powerful imaging techniques allow us to track the spatiotemporal changes in the microenvironment over the course of therapies.
As per Yinyin et al 2022, the first step in understanding heterogeneity is to identify patterns. A rapidly emerging concept is to consider “space as a surrogate.” In cancer research this has high relevance as in many situations’ direct experimental manipulation or direct measurements on human tissues without subjecting to further modification are not possible. Most cancer data have been gathered using biopsy and surgical resection of samples. A key benefit of using “space as a surrogate” in studies of cancer is the amount of spatial data a single tumor can provide alone. With thousands or millions of cells as spatial points, a statistically significant spatial pattern is more likely to be generated by biological processes than noise or biases.

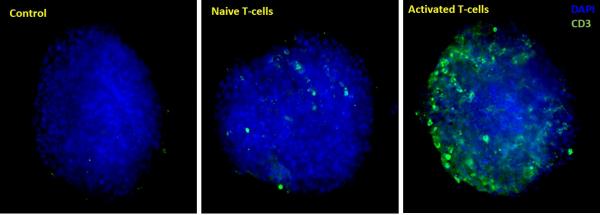
Maximum Z-projection of Z-stack obtained from High Content Imaging of tumor spheroids in the presence of activated and naive immune cells. Data was quantified by automated image analysis to count total number of cells, and number of infiltrating immune cells.
Immune Cell Distribution
How immune cells distribute relative to cancer cells may have profound clinical implications. The Morisita –Horn index is a measure of similarity among community structure in ecology. In breast tumors, this index has been used for quantifying colocalization of immune and cancer. Because the Morisita index measures colocalization, the opportunity to directly relate this quantitative index with clinical outcome may provide a clue as to the extent to which cancer cells have evaded antitumor immune response or recruited immune cells with protumor effect. If a low Morisita score (low levels of colocalization of immune and cancer cells) is associated with a poor clinical outcome, this might suggest that cancer cells have evolved immune evasion strategies in these patients. A high Morisita score (high levels of colocalization) associated with a good prognosis might indicate effective immune predation. Another type of spatial pattern is spatial clustering. Many methods have been proposed to identify such a pattern. For example, statistical tests such as the Ripley’s K function, can be used to confirm the presence of spatial clustering. Alternatively, there are methods to identify specific regions where spatial clustering exists, such as the hotspot analysis. Histological sections can often contain up to millions of cells. It is thus a nontrivial task to discern spatial patterns from data at this scale. Tessellation effectively reduces complex problems to individual local structures. A tessellation is a mosaic set of spatially separated polygons. Commonly used tessellation models include Voronoi tessellation, it is generated by seeds/spatial points to create polygons that contain all their closest neighbors.
Thus, spatial analysis empowered by large-scale analysis of histology samples can aid in studying effectiveness of oncotherapies including immunotherapies in a more in-depth and insightful manner and aid in the identification of patients at higher risk of progression or treatment resistance who may benefit from new treatments.
To learn more about Visikol’s biomarker panels designed to spatially image tumor microenvironment and the in-depth image analysis solutions we offer please reach out.
