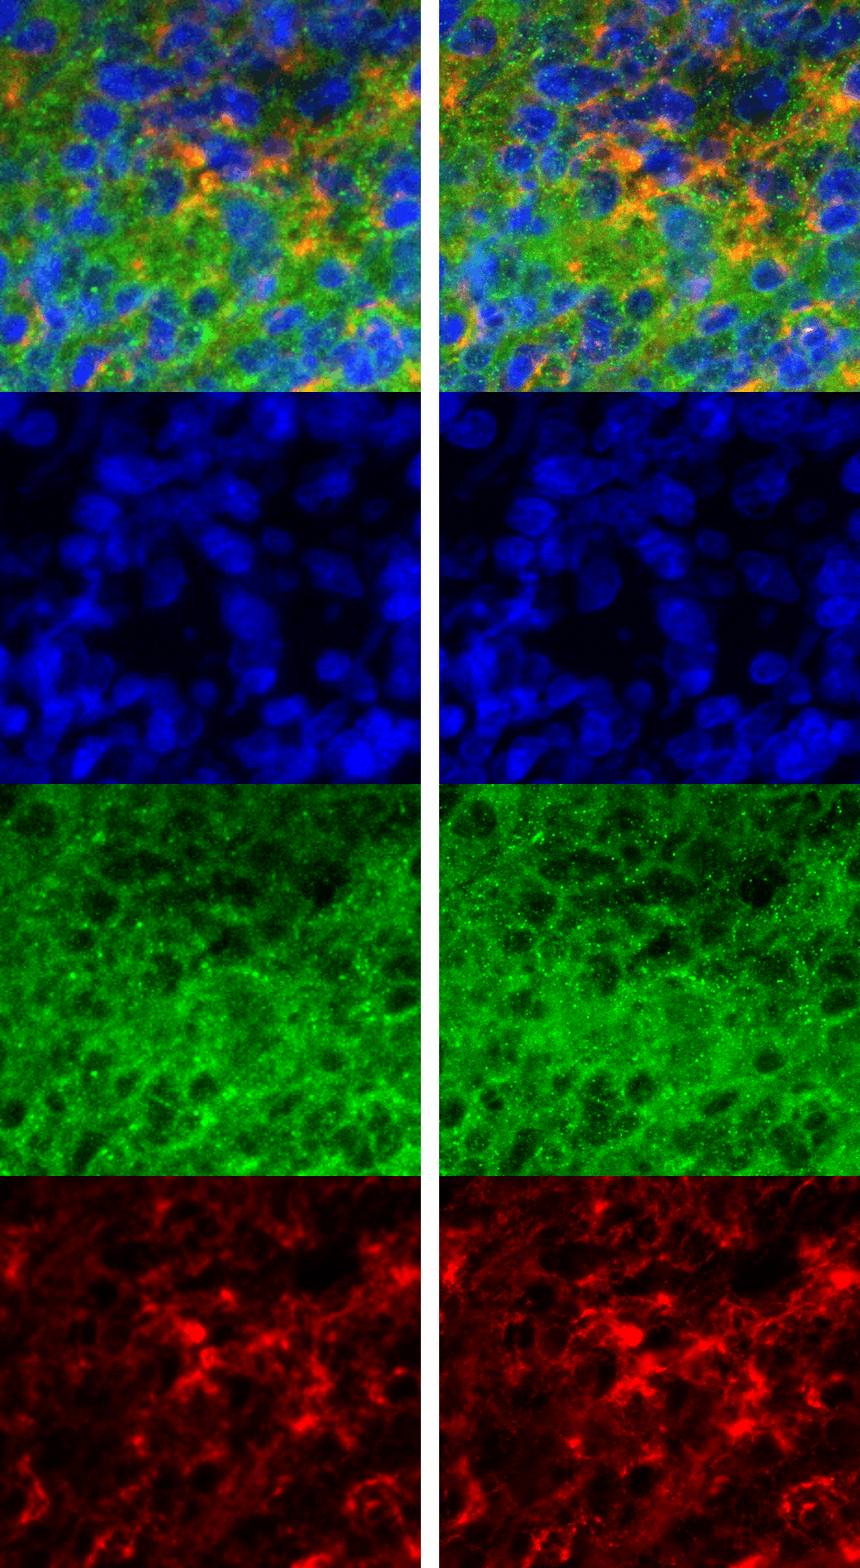
In this blog post, we confront the assumption that confocal imaging is superior for every application. We do so by comparing two datasets of the same tissue, stained with DAPI, CD4, and PDL-1. Both image sets were acquired using a 20X objective in slide scanning mode. The tissue was first imaged using the Molecular Devices ImageXpress Micro in Confocal mode (using a 60um pinhole) and subsequently imaged using the Zeiss Axioscan 7 in EDF mode (Extended Depth of Focus).
Benefits to Confocal Imaging
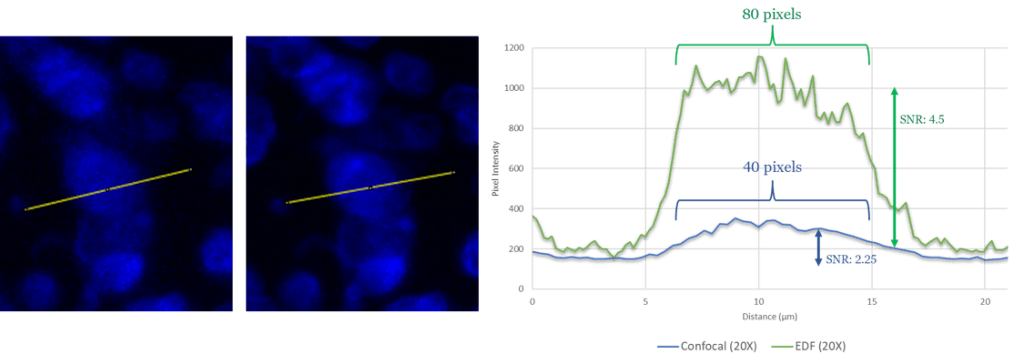
The biggest benefit to confocal imaging is the reduction of out of focus light, resulting in a sharper images with enhanced signal-to-noise. What is often not considered, is that these goals can often be accomplished through a combination of advanced acquisition algorithms and highly efficient quantum detectors . Figure 1 illustrates how Zeiss EDF produces higher-quality images, while Figure 2 demonstrates that Zeiss EDF surpasses MolDev Confocal in spatial resolution and noise reduction. Remarkably, all these improvements come with higher acquisition speeds, most notably in the DAPI channel, which is acquired 1000 times faster per frame.
Challenges with Confocal Imaging
While confocal imaging can be advantageous in specific cases, it’s crucial to acknowledge the trade-offs. The most significant challenge when attempting to improve counting statistics is the consequence of photobleaching (the fading of fluorescent signals) and phototoxicity (cell damage). The experts at Visikol have a deep understanding of the benefits, trade-offs, and limitations of each imaging modality at our disposal; we are here to help you make the best decisions possible when assessing your research goals and experimental conditions. Reach out to a member of our team to get started today!

Figure 1:Resulting image of MolDev Confocal (left) and Zeiss EDF (right). Blue, green, and red colormaps represent DAPI, PDL-1, and CD4 signals respectively. Animated GIF loops through each channel, and the composite image.

Figure 2: Intensity profiles of the same extracted from both datasets, where the x-axis is the distance in um (converted from pixel resolution) and the y-axis is the pixel intensity. The 0 position on the x-axis indicates the left most position on the yellow line in each associated image, where Confocal and EDF image are displayed left and right respectively.
